Posts Tagged ‘Economy’

What is the State of the U.S. Economy?

Tuesday, December 12th, 2023

There are many different opinions on the state of the U.S. economy. This is normal when we are entering an election year.  The political party in power wants the economy to appear good or better than the previous administration, and the opposing political party wants it to appear worse than when they were in power.

Let’s examine what are the key economic indicators as well as other data to determine the true state of the U.S. economy.  According to the website, USA Facts, the key economic indicators are:  GDP, inflation, Federal Reserve interest rates, workers’ average hourly wages, unemployment rate, ratio of unemployed people related to job openings, labor force participation rate, trade deficit (imports vs. exports), and Federal debt. USA Facts only reports the figures at the end of the year so the data shown is for 2022 since 2023 hasn’t ended yet.

Gross Domestic Product 1970 – 2023

Labor Force Participation Rate

The rate is calculated as the labor force divided by the total working-age population. The working age population refers to people aged 15 to 64. This indicator is broken down by age group and it is measured as a percentage of each age group.

The labor force participation rate was 66.0% in 2008, and gradually dropped down to 63.3% by January 2020.  As a result of the COVID-19 pandemic, it dropped to a low of 61.5% in November 2020 before gradually rising to 62.8% in November 2023.

Ratio of Unemployed People to Job Openings

According to the Bureau of Labor Standards, “The ratio of unemployed people to job openings ranged from 0.8 to 1.0 during 2018 and 2019. Over the past 5 years, the number of unemployed people per job opening reached a high of 4.9 in April 2020, when there were 23.1 million unemployed people and 4.7 million job openings. Since October 2021, the ratio has been 0.5 or 0.6 every month…When ratios equal 1.0, there is approximately 1 unemployed person per job opening. When less than 1.0, the labor market is tight, as job openings outnumber the unemployed. When greater than 1.0, there are more unemployed people than available jobs..”

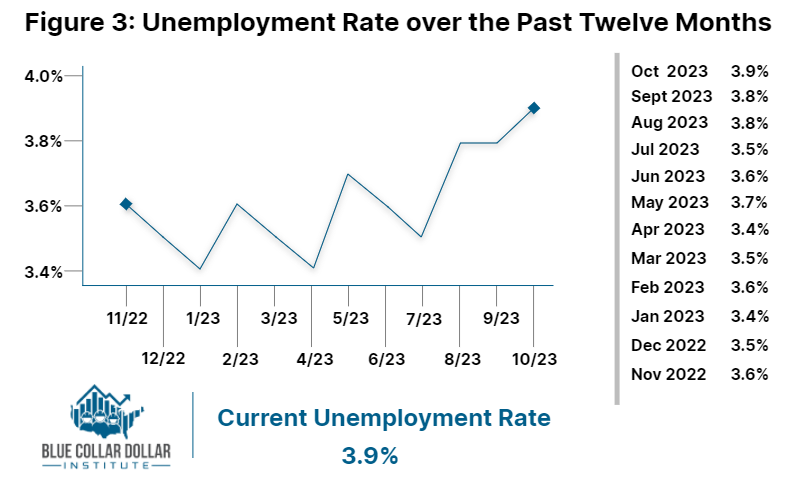
The unemployment rate of the United States which has been steadily decreasing since the 2008 financial crisis, but spiked to 8.1 percent in 2020 due to the COVID-19 pandemic. The annual unemployment rate of the U.S. since 1990 can be found here.

Federal Fund Interest Rates

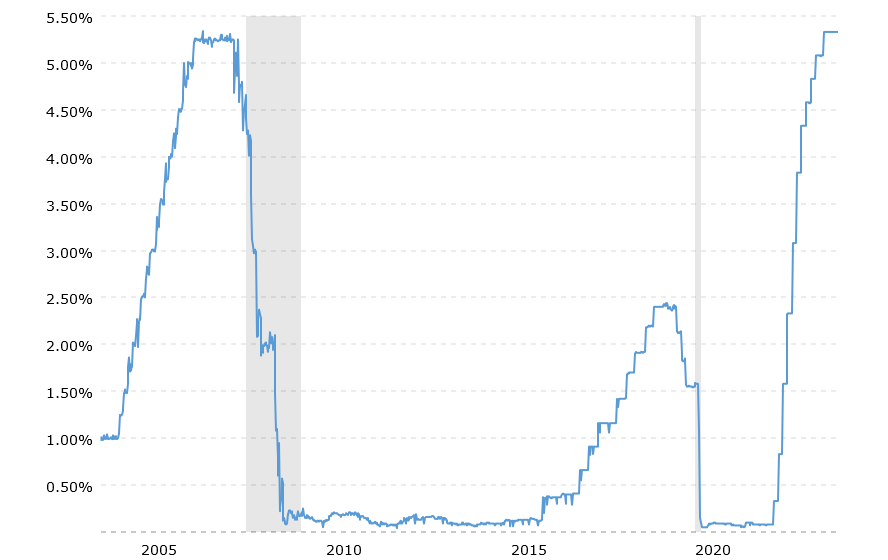
The Federal Reserve raised interest rates seven times in 2022 and four times in 2023, increasing the target rate from nearly zero (0.25%) in 2020-2021 to 5.25%-5.50% currently. The Fed is expected to hold rates steady when they meet this month. The Fed rate affects the consumer interest rates for mortgages and installment loans for things like cards, home furnishings, and other consumer goods.  Mortgage rates have risen from 2.75-3.25 in 2021 to 6.0%-7.9% in 2023.  This has stagnated sales for homes and automobiles.

National average wage indexing series, 2001-2022

Year  Annual Wage YearAnnual Wage
2001$32,921.92 2012$44,321.67
2002$33,252.09 2013$44,888.16
2003$34,064.95 2014$46,481.52
2004$35,648.55 2015$48,098.63
2005$36,952.94 2016$48,642.15
2006$38,651.41 2017$50,321.89
2007$40,405.48 2018$52,145.80
2008$41,334.97 2019$54,099.99
2009$40,711.61 2020$55,628.60
2010$41,673.83 2021$60,575.07
2011$42,979.61 2022$63,795.13

Data source:  https://www.ssa.gov/oact/cola/AWI.html

It looks like wages have nearly doubled in 21 years, but the value of the dollar has changed over time. According to the CPI Inflation Calculator, the ”U.S. dollar has lost 42% its value since 2001; $100 in 2001 is equivalent in purchasing power to about $173.73 today…The dollar had an average inflation rate of 2.54% per year between 2001 and today, producing a cumulative price increase of 73.73%.” This we need to deduct 42% from the 2022 wage to compare it to 2001 ($63,795.13 – $27,431.91 = $42,363.23). Thus, the wages only went up by 34% while inflation increased 73.73%. 

U.S. Private Sector Job Quality Index

The November Job Quality Index report by The Coalition for a Prosperous America states, “The Job Quality Index measures job quality for U.S. production and non-supervisory workers by comparing workers’ weekly wages to the mean weekly wage for all non-supervisory workers. Those jobs above the mean are classified as high-quality and those below the mean are low-quality…Over the past three decades, the JQI declined because the U.S. economy created more low-quality jobs than it has high-quality jobs. As shown in Figure 1, the JQI is down 12.8% from 1990 illustrating the disproportionate growth in low-wage, low-hour jobs.”

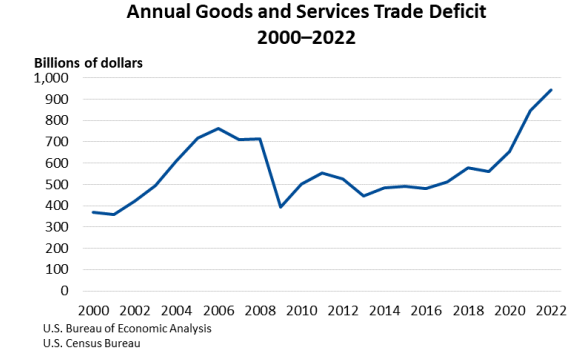
The last year that the U.S. had a positive trade balance by exporting more than we imported was 1979. The trade deficit grew gradually from 1980 – 1999, but accelerated after China was granted Most Favored Nation status in the year 2000.  In 2022, the trade deficit of $948.1 billion a 3.9% increase from 2021.

For my industry of manufacturing, there are two other measures that can be examined to determine the true state of the economy.  They are:

US ISM Manufacturing PMI

The Institute of Supply Management Purchasing Managers Index “is a diffusion index summarizing economic activity in the manufacturing sector in the US. The index is based on a survey of manufacturing supply executives conducted by ISM. Participants are asked to gauge activity in a number of categories like new orders, inventories, and production and these sub-indices are then combined to create the PMI… A PMI above 50 would designates an overall expansion of the manufacturing economy whereas a PMI below 50 signifies a shrinking of the manufacturing economy.

US ISM Manufacturing PMI was at a level of 46.70 on November 30, 2023, unchanged from 46.70 for October and down from a recent high of 64.70 in March 31, 2021.  The PMI dropped to 49.00 for the November 30. 2022 report, so we have been in a shrinking economy for 13 months.  

U.S. Manufacturing Technology Orders  

According to the November report published by AMT, The Association For Manufacturing Technology, “orders for manufacturing technology…continued to fall relative to 2022. Through October 2023 orders totaled $4.05 billion, 13.5% behind the total for the first 10 months of 2022.  

Conclusion:  Adding to the above data is the fact that vehicle gas prices have escalated since 2020.  According to Finder, “Gas prices in over the last 12 months are well above the national average over the last six years, hitting $4.99 a gallon in the week of June 16, 2022 — a week in which Californians paid a whopping $6.43 per gallon…The national average gas price this week [December 7th] is $3.22, down from $3.27. US gas prices over the last year are among the highest since 2018. California has the highest gas prices in the nation, followed by Hawaii as a close second, and Washington, Nevada, and Oregon making up the top five.  Texas has the lowest gas price ($2.68) in the nation followed closely by Mississippi ($2.72) and Oklahoma ($2.74). 

According to the U.S. Government Accountability Office, “Last year, U.S. consumers saw the largest annual increase in food prices since the 1980s. While food prices generally increased about 2% in prior years, they increased about 11% from 2021 to 2022…Food prices increases also varied by locality. For example, the highest increase between 2021 and 2022 was seen in Detroit Michigan (about 14.5%). The lowest (about 5%) occurred in the Miami-Fort Lauderdale, Florida metro area…Finally, food price increases from 2021 to 2022 varied by food group. For example, prices for grains and bakery products increased by about 13%, while fruits and vegetables increased by about 9%.  Similarly, dairy products increased by about 12%, but meats, poultry and fish increased about 10%.”

I am not an economist qualified to do an educated analysis of all of the above data, but it is obvious to me that the U.S. economy has some serious problems that need to be urgently addressed if we want to avoid a prolonged recession. The question that voters ask themselves in an election year, “Am I better off now than I was under the previous administration.”  The answer to that question will determine the outcome of the next election.    
 

Reshoring Critical Pharmaceuticals and Manufactured Goods Would Create Millions of Jobs

Tuesday, March 31st, 2020

It’s a pity that it took the coronavirus pandemic to wake up Americans to the dangers of our dependence on foreign sources for pharmaceuticals and health care products. Perhaps we could have saved lives if our leaders had taken heed to the warning of co-authors Rosemary Gibson and Janardan Prasad Singh in their book China RX, published in 2018. The authors exposed how the pharmaceutical industry has transferred the manufacturing of generic drugs, vital medicines and medical devices to China and other countries, which has resulted in great risk to the health of Americans as well as a substantial risk to our national security.

In their book, they quote Dr. Goodman, dean of the Milken Business School of Public Health at George Washington University, saying, “It is a matter of national security that we have the essential drugs we need…I think it is time for an examination, for some of the most critical drugs, and it’s not just drugs, medical supplies, masks are all made overseas. Do we need to think about having at least some resilient manufacturing capacity built in this country?”

Yes, we do need to return the manufacture of pharmaceuticals and medical devices to benefit the health and safety of all Americans. Additionally, there would be economic benefits. On March 17th, the Coalition for a Prosperous America released a report on the results of the investigation conducted by Steven L. Byers, PhD and Jeff Ferry of their research team into the potential economic benefits of reshoring pharmaceutical production to the U.S.  They “found that an ambitious but realistic reshoring program could create 804,000 US jobs and add $200 billion to annual GDP in the first year.”

Their investigation showed that imports of pharmaceuticals had increased “dramatically as US-based drug manufacturers moved manufacturing facilities offshore.” By 2019, “pharmaceuticals ranked third as a US import category [$74 billion], behind automobiles ($180 billion) and crude oil ($132 billion) …”

The report states” Eighty percent of all pharmaceutical imports are accounted for by the top ten countries. Seven of the top ten countries we import from are in Europe…” Ireland is number one followed by Germany, Switzerland, Italy, India, Denmark, Belgium, Canada, United Kingdom, and Japan of the top ten. “China is well behind the leaders, in 17th place, with just $1.6 billion of pharmaceutical imports last year.”

However, “the Census category of pharmaceutical imports does not include the key ingredients that go into pharmaceuticals, known as Active Pharmaceutical Ingredients (API).” In recent testimony to Congress, Rosemary Gibson, author of China RX, stated “that three antibiotics used to treat coronavirus or related infections, azithromycin, ciprofloxacin, and piperacillin/tazobactam, are all dependent on supplies of APIs from China.” Senate Finance Committee chairman Charles Grassley commented, “80 percent of Active Pharmaceutical Ingredients are produced abroad, the majority in China and India.”

Byers and Ferry “used  the REMI Policy Insight Model[1] to estimate the impact on the US economy of restoring our level of pharmaceutical imports to the level of 2010, when we imported $61.6 billion of pharmaceuticals [and] reduced chemical imports by $4.9 billion in [their] simulation, to account for the increased imports of chemical ingredients that go into pharmaceuticals.” They ran the “model over a five-year period, 2020 through 2024.”

While the creation of jobs was the highest the first year at 804,000, the subsequent years created 614,000 in 2021, 548,000 in 2022, 453,000 in 2023, and 371,000 in 2024 for a total of 2,382,000 additional jobs.

Pharmaceutical and medicine manufacturing jobs pay a median income of $74,890, which is “47 percent higher than the median for all private-sector employees.”

The authors comment that “The economic benefits of reshoring US pharmaceutical production are thus substantial. They are also strategic; in that they would reduce US dependence on potentially hostile countries like China. In times of pandemic, there is also a non-zero risk that even friendly nations will prioritize their own citizens over exports. At the very least, the US needs a comprehensive audit of its dependence on individual nations and companies for pharmaceuticals, APIs, and any other key inputs.”

They conclude that “The US has become increasingly dependent on imports of foreign produced pharmaceutical and other health care products as well as the ingredients that go into their production. As a result, the supply chain is highly susceptible to interruption which would put significant pressure on our healthcare system…The benefits of reshoring pharmaceutical and ingredient production are large in terms of national security, patient safety, and economic welfare.”

On Friday, March 27th, the Trump Administration announced it would use the Defense Production Act, to compel General Motors to make more ventilators quicker than the company had planned to produce..

In an article in the Washington Post on March 28th, Joshua Gotbaum wrote: “Under the Defense Production Act, the federal government can, like a traffic cop, direct that inventories be allocated where they are needed most urgently. That’s what FEMA does during floods and hurricanes…The DPA also allows government to move its orders to the front of the line. The Defense Department does this regularly, but the act can be used for more than defense…The government can also use the act to order, and then pay for, expanded production, with new products or new plant capacity. “  

He recommended “The administration needs to act quickly, the DPA using all of its authority to procure not just ventilators but also test kits, masks and other equipment for health-care workers and covid-19 victims.” Mr. Gotbaum speaks from experience as he administered some Defense Production Act authorities as assistant secretary of defense in the 1990s and is currently a guest scholar in the Brookings Institution’s Economic Studies Program.

The benefits of reshoring would be even greater if we returned all critical manufactured goods to the U.S. than just returning pharmaceutical and medical products.  According to recent Reshoring Initiative data, Harry Moser, over 3,000 companies have reshored, creating about 740,000 jobs.  He estimates that if we reduce our trade deficit caused by importing more than we export by 20%, it would create one million jobs. Using the free Total Cost of Ownership Analysis calculator available at www.reshorenow.org would help more companies return manufacturing to America.

We need to ensure that we will have the critical products needed to weather future unforeseen events. In my opinion, the policies to address the Coronavirus crisis should be just the beginning of a concentrated effort to reshore all critical manufactured goods to America. Let’s use all of the potentially available policies:

  • Invoke the Defense Production Act on all critical manufactured goods
  • Impose 25% tariffs on all imported goods from China
  • Incentivize manufacturers to produce products that were offshored to China

CPA Criticizes Peterson Report on Trans Pacific Partnership Agreement

Sunday, March 13th, 2016

On January 25, 2016, the Peterson Institute for International Economics (PIIE) released a report  on the Trans-Pacific Partnership trade agreement. The Coalition for a Prosperous America (CPA) promptly released their commentary on the Peterson Institute report the same day, which was based on oral and written testimony CEO Michael Stumo had given to the U. S. International Trade Commission on January   15, 2016.

The Peterson Institute used the “”computable general equilibrium (CGE) model.” I’m not an economist. I live and work in the real world of manufacturing. Thus, I am not familiar with some of the terms economists use for economic models, and had not heard of this term previously. I try to find explanations that make sense, but even the Wikipedia definition was complex; “A CGE model consists of (a) equations describing model variables and (b) a database (usually very detailed) consistent with the model equations… CGE models are useful whenever we wish to estimate the effect of changes in one part of the economy upon the rest. For example, a tax on flour might affect bread prices, the CPI, and hence perhaps wages and employment. They have been used widely to analyse trade policy.”

The World Bank states, “Computable General Equilibrium (CGE) models offer a comprehensive way of modeling the overall impact of policy changes on the economy… However, CGEs are significantly affected by the assumptions that they are based on which, depending on their definition, can impact on the results.”

CPA criticized the PIIE for using “the controversial computable general equilibrium (CGE) model to analyze the TPP rather than models that produce less optimistic results.” Stumo stated that the CGE model is increasingly recognized as unreliable because:

Untrue Facts Assumed ? “full employment always exists, trade is in balance, that wages and productivity stay in alignment rather than diverge, and that all countries have perfectly free markets with rational economic behavior.” These assumptions are false ? “full employment rarely exists; trade is almost never in balance; wages have diverged downward from productivity for the past several decades; and many TPP countries have state-directed capitalism or strong industrial policies to influence and alter market outcomes.”

Untrue Past Results ? The CGE model was used to analyze China’s being granted Permanent Normalized Trade Relations with China (China PNTR) in 2000 and the Korea-U. S. trade (KORUS) agreement in 2012. A reduction in the trade deficits were predicted for both countries, but the reality is that U. S. trade deficit with China increased from $68.7 billion in 1999 to $337 billion in 2015, and the Korea trade “deficit worsened by $12 billion annually between 2012 (date of KORUS implementation) to 2015.” (US Census Bureau)

Untrue Assumption of No Net Job Losses? “The CGE model wrongly assumes that there are no job losses to produce its results. The International Trade Administration assumes that for every billion dollars of U.S. exports supported 5,796 jobs, down from 7,117 jobs per billion dollars of U.S. exports in 2009. Conversely, every billion dollars of imports has the opposite result. Thus, where trade agreements result in worsening trade deficits, as is the case for the NAFTA, Korea and China PNTR deals, the job losses are drastic.”

Additionally, Stumo criticized the Peterson report because it ignores the fact the Trans Pacific Partnership Agreement does not address problems with currency misalignment, border taxes (VATs), and industrial policies, such as state-owned enterprises and government subsidies.

Stumo stated, “The PIIE model incorrectly assumes that currency valuations will be set by the perfectly free market and will not be manipulated. It does not take into account rising foreign value added taxes – which replace tariffs – charged to imports from the US.  It also ignores the industrial policy and state-directed strategies that Japan, Vietnam and others use to give an advantage to state-influenced or national champion domestic industries.”

Stumo criticized the fact that PIIE admits the TPP will create no new jobs and little growth even if the CGE model’s conclusions are true.

Job Creation Will Not Occur ? “…while the TPP is not likely to affect overall employment in the United States, it will involve adjustment costs as US workers and capital move from less to more productive firms and industries. Section 4 estimates that 53,700 US jobs will be affected—i.e., that number is both eliminated in less productive import-competing firms and added in exporting and other expanding firms—in each year during implementation of the TPP. This kind of movement between jobs and industries is what economists refer to as “churn,” and most kinds of productivity growth cannot occur without it taking place. For perspective, 55.5 million American workers changed jobs in this way in 2014—so the transition effects of the TPP would represent only less than 0.1 percent increase in labor market churn in a typical year. Most workers who lose jobs do find alternative employment, but workers in specific locations, industries, or with skill shortages may experience serious transition costs including lasting wage cuts.”

The Peterson report even admits job loss from past trade agreements, stating “The largest loser is the United States, whose trade and current account deficits have been $200 billion to $500 billion per year larger as a result. The United States has thus suffered 1 million to 5 million job losses.

The reality is that we lost 6.2 million manufacturing million jobs in the past 20 years as a result of NAFTA, China’s being granted PNTR in 1999, and the subsequent trade agreements with Central America, Korea, and other countries. Since manufacturing jobs create three to four other supporting or related jobs, we really lost 18 – 20 million jobs, which partly explains why 94,610,000 Americans are no longer in the labor force, which is the lowest participation rate in 38 years.

What do the report’s authors mean by “import-competing firms”? It appears to me that this means American manufacturing firms whose domestically-made products compete with imports for market share in the U. S. In addition, the Made in USA products are also competing as exports to other countries against the exports of China, Korea, our other trading and non-trading partners. So what guarantee do we have that the people losing jobs at import-competing firms will find jobs at exporting companies? None!

In addition, the CPA commentary highlighted the following:

Income gains are Negligible ? “The study projects that, by 2020, US incomes will rise a mere 0.1% of GDP. (Table 2).  This means that 99.9% of growth will happen without regard to the TPP.  The number 0.1% is equivalent to, or less than, a rounding error. It can only come true if all untrue assumptions in the CGE model are true. It will take another 10 years for the optimistic projection to deliver a meager 0.5% income gain by 2030.”

Middle Class Will Not Benefit ?  “Assuming (which we do not) the small income gains are realized, the study is silent on who benefits from them. The Economic Policy Institute reported that trade agreements account for 90% of wage inequality. If there are any income gains, the middle class will be a net loser.”

Other countries will “benefit” more than the US ? “The Peterson Study projects that Japan, Malaysia and Vietnam will gain far more than the United States.  The US Trade Representative, by pushing the TPP, is helping open markets for competitors in Japan and other countries. Japan is estimated to gain five times more income (in relation to GDP) than the US, Vietnam 16 times more, and Malaysia 15 times more. (Report, Table 2).”

Finally, the CPA commentary points out that other economic models show losses to the U.S. and other TPP countries. The commentary cites the fact that scholars at the Global Development And Environment Institute of Tufts University released a working paper in January 2016 that used the United Nations Global Policy Model (GPM). The Executive Summary of this paper states, “This GDAE Working Paper employs a more realistic model that incorporates effects on employment excluded from prior TPP modeling. We find that any benefits to economic growth are more limited, and even negative in some countries such as the United States. More importantly, we find that TPP would lead to losses in employment and increases in inequality. This is particularly true for the United States, where GDP is projected to fall slightly (-0.54 percent), employment to decline by 448,000 jobs, and inequality to increase as labor’s share of income falls by 1.31 percent.”

The paper states that the job loss would not be limited to the U. S, stating, The TPP would lead to employment losses in all countries, totaling 771,000 lost jobs…Participating developing economies would also suffer employment losses, as greater competitive pressures force them to limit labor incomes and increase production for export.”

In fact, it also states that job losses would not be limited to TPP trading partners: “The TPP would lead to losses in GDP and employment in non-TPP countries. In large part, the loss in GDP (-3.77 percent) and employment (879,000) among non-TPP developed countries would be due to losses in Europe, while developing country losses in GDP (-5.24%) and employment (-4.45 million) would reflect possible losses in China and India.”

The CPA commentary concludes that “the PIIE report as revealing the lack of any economic benefit from the TPP under the most optimistic, albeit implausible, circumstances. It is more likely that job destruction and industry shrinkage will continue being the net result.”

I will be even more emphatic in my predictions if the TPP is approved by Congress. The TPP will result in millions of job losses since past predictions were always exceeded. It will be another nail in the coffin of American manufacturing. The TPP is so overreaching in its scope that it would change many aspects of American life. I’ve written several previous articles posted on the blog section of my website under “trade” on the dangers of the TPP and why we must stop it from being approved by Congress. Do your own research and don’t be fooled by the rhetoric of its supporters. You can read the full text of the agreement for yourself here.