On November 14, 2019, Cornel Law School “announced the launch of a new tool for evaluating the U.S. employment situation and predicting related variables: the U.S. Private Sector Job Quality Index (JQI).” The Index described in the White Paper represents 18 months of research by Daniel Alpert, adjunct professor at Cornell Law School and founding managing partner of the investment bank, Westwood Capital, LLC, Jeffrey Ferry, chief economist at the Coalition for a Prosperous America (CPA), Dr, Robert C. Hockett, Professor of Law at Cornell Law School, and Amir Khaleghi, a Research Fellow at the Global Institute for Sustainable Prosperity (GISP) and a PhD student at the University of Missouri–Kansas City.
At the many economic summits I’ve attended over the past 25 years, I’ve heard economists state that the U. S. is creating more low paying jobs than high paying jobs but there hasn’t been any data available to track this trend on a regular basis. For the first time, the Job Quality Index provides a tool to measure “desirable higher-wage/higher-hour jobs versus lower-wage/lower-hour jobs.”
The authors define job quality as “the weekly dollar-income a job generates for an employee” They explain that “The JQI is an analysis of weekly incomes earned by the holders of each of the private sector P&NS jobs in U.S. It derives its data from the hourly wages paid, and hours worked by, holders of jobs in 180 separate sectors of the American economy.”
Since the end of WWII, the “percentage of private U.S. jobs in the service-providing sectors increased steadily from approximately 55%” to “around 83.5%” at the end of the Great Recession in 2009. It has remained flat since that point. However, the paper states that “While service-sector growth as a percentage of all jobs has leveled off, job quality continues to worsen.”
The authors commented, “As weekly earnings of services sector jobs have, to an increasing degree, materially lagged those of jobs in the goods- producing sector (Figure 6), an increase of the percentage of service sector jobs would naturally result in an increase in the number of jobs below the mean, as reflected in the JQI.”
In addition, the authors note that the gap between higher-wage/higher-hour jobs versus lower-wage/lower-hour jobs” has widened almost four-fold to $402 in 2018 from $104 in 1990”
The paper states, “jobs as tracked by the JQI are defined by reference to data on private sector (nongovernmental) employment provided by third party employers—it does not include self-employed workers. In the first iteration of the JQI being presented in this paper, the index covers only production and nonsupervisory (P&NS) positions, which account for approximately 82.3% of the total number of private sector job positions in the country.”
By the end of 2020, a second index (JQL-2) “will run and be maintained side-by-side with the original JQI-1 index. This will track all private sector jobs, with data commencing in 2000.”
Monthly revisions to the JQI-1 will be published “contemporaneously with the monthly release of U.S. employment data by the BLS (generally on the first Friday of each calendar month. In the future, the JQI will be “presented as a three-month rolling average of monthly readings. This is done to address month over month variability which is too volatile to be a reliable directional trend measure.”
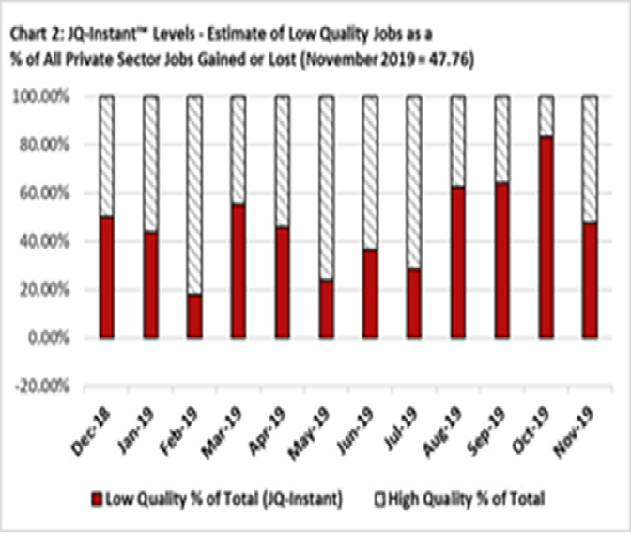
The November JQI stated: “the U.S. Private Sector Job Quality Index (JQI)® has been revised to a level of 80.39, representing a minor decline of 0.04% from its level one month ago and reflecting a somewhat lower proportion of U.S. production and non-supervisory (P&NS) jobs paying less than the mean weekly income of all P&NS jobs, relative to those jobs paying more than such mean. The mean weekly income of all P&NS jobs as of the current reading (reflecting the level as of October 2019) was $794, a change of 0.9% from its level the month prior.” The chart released is shown below:
The paper is divided into five parts:
Part I — Need for the JQI: The Unmeasured Problem with American Jobs
Part II — Construction of the JQI: Capturing and Tracking the Data (explains the development technical detail, setting forth the assumptions and algorithms inherent in its generation)
Part III — Applying the JQI: Illuminating Areas of Confusion in Economic Transmission (discusses the relationship and potential forecasting usefulness of the index in connection with other economic data)
Part IV — Further Developing the JQI: What the Future Holds for the Index (discusses future maintenance and expansion of the index)
Part V — Conclusion: An Index for our Time
Among other things, Part III discusses “The relevance of the resulting “Phillips Curve,” relating lower unemployment to higher levels of inflation…[which] remains—in various modified forms—part of central bank policy consideration to this day.”
It also discussed the impact of the JQI on household incomes and consumption with regard to the U.S. Balance of Trade in Goods. The authors comment, “…as American consumption has continued to rise, the goods consumed had to be produced by someone—even as U.S. goods production jobs plummeted. As evidenced by the U.S. balance of trade over the past several decades, goods consumed by Americans at the margin came increasingly to be manufactured abroad”
They later comment, “The decline in U.S. job quality over the past three decades is linked substantially to a decline in goods-producing jobs.”
Some of the findings of the research that were of particular interest to me in Part III were:
- “The JQI’s definition of high-quality jobs (those above mean weekly earnings) provided an average of 38.26 hours of weekly work at year-end 2018, compared with low quality (those below the mean) which provided 29.98 hours.”
- The percentage of goods producing jobs as a percentage of total private sector jobs dropped from 25.6% in 1990 (down from a high of 43% in 1960) to 16.4% in 2018.
The researches commented, “Surprisingly, the data as analyzed with the JQI also tend to predict the performances of many other salient metrics of the national economy and—in the end—financial markets too…The JQI can significantly improve decision making of policymakers as well as better-inform participants in the financial markets.”
In their Conclusion, the authors remind us of the fact “that the US manufacturing workforce has declined dramatically in the past three decades.” Between 1970 and 1990, the decline was gradual, going down from “17.8 million manufacturing workers” to “17.7 million.” By the year 2000, “it was down 2.4 percent to 17.3 million manufacturing workers.” In the next decade, “manufacturing employment fell off a cliff. By 2010, manufacturing employment was down a shocking 33.2 percent at 11.5 million. Since 2010, the figure has crept up only somewhat, to reach 12.8 million in May 2019.”
“Meanwhile, the total US working population has grown dramatically over those years. In 1970, manufacturing workers accounted for 22.6 percent of total US civilian employment. As of May 2019, they accounted for just 8.2 percent of the total.”
They comment, “An important question surrounding the decline of manufacturing is whether those leaving manufacturing are transitioning into better or worse jobs. After building the new Job Quality Index, “the answer is that lost manufacturing jobs were chiefly replaced by lower-wage/lower hours service jobs.”
The White Paper confirms my research in writing three books and hundreds of articles in the past ten years — losing millions of manufacturing jobs between 2000 – 2010 resulted in a decline in the middle class because manufacturing jobs are the foundation of the middle class. Without a strong middle class, we risk becoming a nation of “haves” and “have nots.” I hope the Job quality Index will wake up more economists, Congressional representatives, and employees of government agencies to the dangers of this trend before it’s too late.