Archive for the ‘General’ Category

Comparing Trump’s and Biden’s Policies that Support Rebuilding American Manufacturing

Tuesday, October 20th, 2020

For those of us who support the Made in America/Buy American movement and want to rebuild American manufacturing by returning manufacturing to America through reshoring from China, it’s important to consider the policies of President Trump and former V.P. Biden in their bid to be president.  Two policies, tax rates and the cost and availability of energy, have a major effect on where a company chooses to locate their manufacturing or headquarters if they have multiple plants globally. If the corporation has a plant in a country with a lower tax rate, they may choose to shift their profits to the subsidiary in that country.  Bulgaria and the Czech Republic at 10% and Ireland at 12.5% have the lowest corporate tax rates in Europe. American manufacturers that don’t have plants in other countries face the brunt of the tax burden. Personal tax rates are also important as only 30-35% of manufacturers are C corporations; the others are LLCs, partnerships or sole proprietorships where taxes are passed through to the owner(s).

Taxes

Biden’s Tax Policies:

  • Raise the corporate tax rate to 28%.
  • Require a true minimum tax of 21% on ALL foreign earnings of United States companies located overseas (double the current rate). 
  • Impose a tax penalty on corporations that ship jobs overseas in order to sell products back to America.
  • Impose a 15% minimum tax on book income so that no corporation gets away with paying no taxes.
  • Raise the top individual income rate back to 39.6%.
  • Require those making more than $1 million to pay the same rate on investment income that they do on their wages.

Trump’s Tax Policies:

The U.S. had a corporate tax rate ranging from a low of 15% to a high of 35% until the Tax Cuts and Jobs Act (TCJA) was passed by Congress on December 20, 2017, which reduced the corporate tax rate to flat tax of 21%. TCJA also cut capital gains tax to 15 % and increased the estate tax basic exemption amount from $5 million to $10 million.

President Trump’s tax policy platform for re-election focuses largely on promoting and preserving the tax cuts of TCJA and making various tax rate reductions scheduled to expire in 2025 permanent.  Before the Republican convention, his campaign released his agenda, which included:

  • Cutting taxes “to boost take-home pay and keep jobs in America”
  • Enacting “Made in America” tax credits
  • Expanding opportunity zones
  • Enacting new tax credits “for companies that bring back jobs from China
  • Permitting 100% expensing “for essential industries like pharmaceuticals and robotics that bring their manufacturing back to the United States.”

Energy

Biden’s Policies:

Biden’s campaign website.states that he plans to “Move ambitiously to generate clean, American-made electricity to achieve a carbon pollution-free power sector by 2035. This will enable us to meet the existential threat of climate change while creating millions of jobs…”

His plan is for America to achieve a 100% clean energy target by means of:

  • advanced nuclear reactors, that are smaller, safer, and more efficient at half the construction cost of today’s reactors;
  • refrigeration and air conditioning using refrigerants with no global warming potential;
  • using renewables to produce carbon-free hydrogen at a lower cost than hydrogen from shale gas through innovation in technologies like next generation electrolyzers;
  • decarbonizing industrial heat needed to make steel, concrete, and chemicals and reimagining carbon-neutral construction materials
  • leveraging research in soil management, plant biologies, and agricultural techniques to remove carbon dioxide from the air and store it in the ground; and
  • capturing carbon dioxide through direct air capture systems and retrofits to existing industrial and power plant exhausts, followed by permanently sequestering it deep underground or using it to make alternative products like cement.”

Trump’s Policies:

  • Since he took office, President Trump has rolled back hundreds of environmental protections, including limits on carbon dioxide emissions from power plants and vehicles, and protections for federal waterways across the country, fulfilling a campaign promise from 2016.
  • On June 1, 2017, Trump announced the U.S. withdrawal from the Paris Climate Agreement, saying the deal disadvantaged the US “to the exclusive benefit of other countries.”
  • His administration approved oil and gas drilling in Alaska’s Arctic National Wildlife Refuge, which has been off-limits for drilling for decades.
  • President Trump supports development of all forms of energy without subsidies, including production of natural gas through fracking

Trade/Tariffs

Biden’s Policies

  • Take aggressive trade enforcement actions against China or any other country seeking to undercut American manufacturing through unfair practices, including currency manipulation, anti-competitive dumping, state-owned company abuses, or unfair subsidies.
  • Rally our allies in a coordinated effort to pressure the Chinese government and other trade abusers to follow the rules and hold them to account when they do not.
  • Confront foreign efforts to steal American intellectual property.
  • Address state-sponsored cyber espionage against American companies.
  • Apply a carbon adjustment fee against countries that are failing to meet their climate and environmental obligations to make sure that they are forced to internalize the environmental costs they’re now imposing on the rest of the world.

Trump’s Policies:

  • On January 23, 2017, Trump signed an order to withdraw from further negotiations on the Trans-Pacific Partnership.
  • On September 2, 2017, Trump instructed aides to withdraw from the U.S. trade agreement with South Korea and later renegotiated a better trade agreement.
  • On August 16, 2017, the Trump administration began renegotiating NAFTA with Canada and Mexico. NAFTA was replaced with the new United States–Mexico–Canada Agreement (USMCA), signed on November 30, 2018.
  • On January 22, 2018, Trump imposed tariffs and quotas on imported solar panels and washing machines.
  • ? On March 1, 2018, he announced a 25% tariff on steel imports and a 10% tariff on aluminum.
  • On April 3, 2018, Trump announced 25% tariffs on $50 billion in Chinese imported electronics, aerospace, and machinery.
  • On April 6, 2018, Trump announced tariffs on $100 billion more of Chinese imports.
  • On October 7, 2019 the United States and Japan signed two agreements intended to liberalize bilateral trade. The U.S.- Japan Trade Agreement (USJTA) provides for limited tariff reductions and quota expansions to improve market access.
  •  On January 15, 2020, President Trump and Vice Premier Liu H of China the US–China Phase One trade deal in Washington DC.

Buy American/Made in America

Biden’s Policies:

  • Make a $400 billion Procurement Investment in American products, materials, and services and ensure that they are shipped on U.S.-flagged cargo carriers.
  • Retool and Revitalize American Manufacturers, with a particular focus on smaller manufacturers and those owned by women and people of color, through specific incentives, additional resources, and new financing tools.
  • Make a New $300 Billion Investment in Research and Development (R&D) and Breakthrough Technologies 
  • Bring Back Critical Supply Chains to America so we aren’t dependent on China or any other country for the production of critical goods in a crisis.
  • Tighten domestic content rules to require more legitimate American content
  • Crack down on waivers to Buy American requirements by federal Agencies
  • End false advertising by companies that label products as Made in America even if they’re coming from China or elsewhere
  • Strengthen and enforce Buy America provisions
  • Update international trade rules and associated domestic regulations for Buy American

Trump’s Policies:

Trump’s campaign slogan revolves around continuing his promise to Make America Great Again. One of the ways is to rebuild American manufacturing and create higher paying jobs. He uses protectionism to defend U.S. industries from foreign competition. According to the National Association of Manufacturers (NAM), the U.S. manufacturing sector, added about 450,000 workers during the first three years of Trump’s presidency before the pandemic. Here are some of the actions he has taken as President.

President Trump’s campaign website also lists the following goals for his next term:

  • Reduce U.S. dependence on Chinese manufacturing and bring back 1 Million Manufacturing Jobs from China
  • No Federal Contracts for Companies who Outsource to China
  • Grant tax credits to companies that move manufacturing back to United States; tariffs on those that don’t.

Remember that actions speak louder than words, so be sure to compare what a candidate has done and not just what they promise to do in their campaign platform. Be sure to vote. The future of our country is at stake.
Market Access Charge Would Eliminate Trade Deficit & Increase GDP

Tuesday, October 6th, 2020

In July 2017, the Coalition for a Prosperous America (CPA) released a paper titled, “The Threat of U.S. Dollar Overvaluation: How to Calculate True Exchange Rate Misalignment & How to Fix It” by Michael Stumo (CEO), Jeff Ferry (Research Director) and Dr. John R. Hansen, a 30-year veteran of the World Bank and Advisory Board member.

The purpose of the paper is to explain the problem of the dollar overvaluation, to show how to accurately calculate the dollar’s misalignment against trading partner currencies, and to propose a solution this serious threat to America’s future. At the time, the dollar was overvalued by 25.5% compared to other major currencies.

The solution developed by Dr. Hansen is a Market Access Charge (MAC) “as a system to discourage overseas private investors and return-sensitive official investors such as sovereign wealth fund managers from excessive speculation and trading in U.S. dollar assets.” He believed that the MAC would reduce “the incentive for foreigners to invest in dollars, gradually and safely reduce its overvaluation, benefiting the U.S. economy and restoring control over our own currency.”

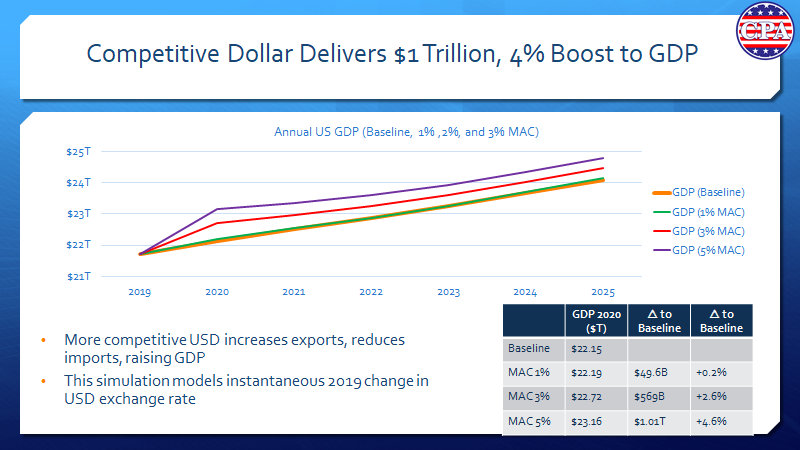
In February 2019, CPA released the working paper, “Quantifying Economic Growth and Job Creation from a competitive Dollar,” showing that a 27 percent realignment in the trade weighted US dollar exchange rate over five years would eliminate the US trade deficit, result in an additional $1 trillion in GDP and create 5.2 million new jobs.

The MAC was proposed in a Senate bill introduced in July 2019, S.2357, titled the

“Competitive Dollar for Jobs and Prosperity Act.” It was introduced by Sen. Tammy Baldwin (D-WI) and Josh Hawley (R-MO), and is languishing in the Senate Committee on Banking, Housing, and Urban Affairs.

On October 5, 2020, CPA released a working paper, “Modeling the Effect of the Market Access Charge on Exchange Rates, Interest Rates and the US Economy,” by Steven L Byers, PhD. and Jeff Ferry.

In Section 1, The Relationship Between International Capital Flows and the Exchange Rate, the authors state thatThe standard open-economy macroeconomic models2 predict that under a floating exchange rate regime, when a country runs a trade deficit/surplus, the exchange rate will adjust to eliminate the imbalance. However, exchange rates have not adjusted and imbalances have persisted. The US trade and current account deficits have continued to run at some 2%-3% of US GDP for decades (Figure 1), suggesting that other forces are preventing the deficits from correcting themselves.”

The authors go into detailed economic models that establish the relationship between equity inflows and the currency dollar exchange rate.

In Section 2, The MAC, Capital Flows and the Dollar Exchange Rate, the authors examined how a charge on capital inflows is likely to impact inflows and the exchange rate, focusing on the Market Access Charge (MAC) discussed above. The authors state: “The MAC would be a one-time fee paid on the purchase of any U.S. dollar financial asset by a foreign entity or individual. The MAC is designed to moderate foreign demand for dollar assets and realign the US dollar exchange rate to a trade-balancing level. The Baldwin-Hawley bill specifies that the Federal Reserve Board would set and manage the MAC to achieve current account balance within a five-year time horizon. Once balance was achieved, the Fed would manage the MAC to keep the US economy close to current account balance over time. “The Baldwin-Hawley bill specifies that the Federal Reserve Board would set and manage the MAC to achieve current account balance within a five-year time horizon. Once balance was achieved, the Fed would manage the MAC to keep the US economy close to current account balance over time.”

This section covers detailed economic models on how the MAC would affect different kinds of equity flows, such as bonds, Treasury notes

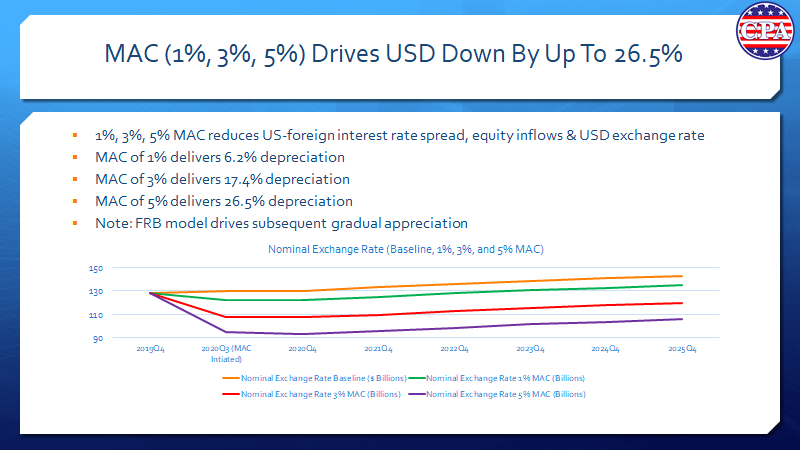
In Section 3, How the MAC Impacts Interest Rates, the authors “sought to estimate the impact of the MAC on the financial sector with a focus upon interest rates and government debt service costs.” They investigated and modeled the effect of a 1%, 3%, and 5% MAC on the nominal exchange rate, 10-year interest rates, and interest rate on outstanding Federal debt.

With regard to revenue the MAC would generate for the US Treasury, the authors comment, “Though the MAC would reduce capital inflows significantly, our model suggests that even with a 5% MAC, gross equity inflows would continue at a rate in excess of $3 trillion a quarter, with inflows into debt securities at similar levels. MAC transaction fees, paid by foreign purchasers of US securities, would provide a large new source of revenue to the US Treasury. Table 4 shows that these revenues could reach $672 billion, equivalent to 19% of last year’s total federal tax revenue.”

In Section 4, Effects on the Economy, the authors state: “…US producers of goods and services would gain market share in the US market and export markets. Our model estimates the impact of increased domestic production over the five-year period on US GDP and employment. In the case of a 5% MAC, the dollar’s exchange value would fall by 27…the more competitive dollar would balance trade, increasing exports by $765 billion or 29.5% over the baseline, and reducing imports by $167 billion (5.1%). The fall in imports is modest because while imports lose share in the domestic market, the rise in economic growth from the more competitive exchange rate boosts GDP, which leads to higher imports. But trade would be balanced. The GDP would rise by $1.01 trillion or 4.6%. Compared to the baseline forecast, the economy would create 4.9 million new jobs by 2025… the new jobs would be weighted towards internationally competitive sectors, notably manufacturing and natural resources, which offer higher pay (and often better benefit packages) than the average US job.”

The authors conclude that “The model shows large benefits to the US economy and the US. Treasury. Further study is warranted and should be pursued.”  I would go one step further and say that the Baldwin-Hawley “Competitive Dollar for Jobs and Prosperity Act.” (S. 2357) should be released out of committee as soon as possible to be debated and then passed in the full session of the Senate.  Reducing our trade deficit, increasing our GDP, and creating more higher paying manufacturing jobs are important actions to be taken to create prosperity in America.

Buying “Made in China” May Support Slave Labor

Tuesday, September 22nd, 2020

One of the consequences of President Clinton’s granting China Most Favored Nation status and allowing them to become a member of the World Trade Organization is that China took over production of consumer goods previously made in the USA. As a result, the consumer products you buy that are “Made in China” may be made by slave labor.

The Global Slavery Index published by the Minderoo Foundation “estimates that on any given day in 2016 there were over 3.8 million people living in conditions of modern slavery in China, a prevalence of 2.8 victims for every thousand people in the country. This estimate does not include figures on organ trafficking…Much of its rapid economic development has been the result of a domestic economy specialising in the production of labour-intensive, cheap goods for export. Forced labour mainly occurs in the production of these goods, including in the manufacturing and construction sectors, as well as in more informal industries…,Other labour-intensive industries in China are also creating a demand for low-paid foreign labour. The sugarcane industry in China’s southern Guangxi province attracts an estimated 50,000 illegal Vietnamese workers. Factory towns in Southern China have been found to employ illegal workers from Vietnam on a widespread basis.”

The Index commented that “The Chinese government officially announced in November 2013 that it would abolish the Re-education through Labour (RTL) System, in which inmates were held and routinely subjected to forced labour for up to four years. However, a 2017 report by the US-China Economic and Security Review Commission alleges that China still maintains a network of state detention facilities that use forced labour.”

The purpose of the U.S.-China Economic and Security Review Commission is to monitor, investigate, and submit to congress an annual report on the national security implications of the bilateral trade and economic relationship between the United States and China, and to provide recommendations to Congress. If you read a chapter or two from any of the reports from 2017 – 2019, you would realize that Congress is not doing enough to address the threats China poses to the U.S.

In the staff research report, “U.S. Exposure to Forced Labor Exports from China,” Alexander Bowe, Research Fellow, write, “China maintains a network of prison labor facilities that use forced labor* to produce goods intended for export—a violation of U.S.-China trade agreements and U.S. law. U.S. officials continue to face considerable difficulty in combating exports of these forced labor products, since cooperation from Chinese interlocutors has remained at low levels for years. U.S. Immigration and Customs Enforcement (ICE) agents have not been permitted to make site inspections in China since 2009…”

In an article on June 11, 2019, the Epoch Times reported, “In undercover footage shot inside China’s notorious Masanjia labor camp, prisoners are shown hunched over work tables, with piles of wire diodes—an electronic component—on either side of a rubber mat. They do this work 15 hours a day, while being fed subsistence meals and receiving a pittance or no pay at all. Some inmates, exhausted, are shown lying down to sleep under their work tables.”

Another Epoch Times article of August 25, 2020, states, “For three years on and off, Li Dianqin worked for about 17 hours a day making cheap clothing—from bras to trousers—in a Chinese prison. She worked for no pay and faced punishment by prison guards if she failed to meet production quotas. One time, a team of about 60 workers who couldn’t reach their quota were forced to work for three days straight, not allowed to eat or go to the bathroom. The guards would shock the prisoners with electric batons whenever they dozed off.”

On March 1, 2020, the Australian Strategic Policy Institute released a report that stated, “Since 2017, more than a million Uyghurs and members of other Turkic Muslim minorities have disappeared into a vast network of ‘re-education camps’ in the far west region of Xinjiang…This report estimates that more than 80,000 Uyghurs were transferred out of Xinjiang to work in factories across China between 2017 and 2019, and some of them were sent directly from detention camps.”

The report explains, “Under conditions that strongly suggest forced labour, Uyghurs are working in factories that are in the supply chains of at least 82 well-known global brands in the technology, clothing and automotive sectors…”  The whole list is too long to publish in this short article, but it includes: Amazon, Apple, BMW, Calvin Klein, Carter’s, Cisco, Dell, General Motors, Google, Hitachi, HP, L.L.Bean, Mercedes-Benz, Microsoft, Mitsubishi, Nike, Panasonic, Polo Ralph Lauren, Puma, Samsung, Sharp, Siemens, Skechers, Sony, Toshiba, Victoria’s Secret, and Volkswagen.

It is noted that “ASPI reached out to these 82 brands to confirm their relevant supplier details. Where companies responded before publication, we have included their relevant clarifications in this report. If any company responses are made available after publication of the report, we will address these online…a small number of brands advised they have instructed their vendors to terminate their relationships with these suppliers in 2020.” The full report can be downloaded here.

On August 13, 2020, The New York Times updated a visual investigation revealing that “As the coronavirus pandemic continues to drive demand for personal protective equipment, Chinese companies are rushing to manufacture the gear for domestic and global consumption. A New York Times visual investigation has found that some of those companies are using Uighur labor through a contentious government-sponsored program that experts say often puts people to work against their will.”

The next time you are ready to buy an article of clothing or a pair of shoes “Made in China,” think about what the working conditions were like for the workers who made these items. Remember that “Made in China” could mean being made in prison by slaves or forced labor at private companies. Avoid buying from online websites as much as possible as current law doesn’t require information on where a product is made. Choose to buy Made in USA whenever possible. Take a look at the variety of products available at these websites:  www.madeinamericastore.com, www.buydirectUSA.com, and of course, www.themadeinamericamovement.com, which publishes my articles.

What Has Been the Impact of COVID-19 Pandemic on U. S. Manufacturing?

Tuesday, September 15th, 2020

How much the impact of the COVID-19 Pandemic has had on manufacturing depends on the state in which a manufacturer is located and what is the industry of the manufacturer.  According to Ballotpedia, “Seven states—Arkansas, Iowa, Nebraska, North Dakota, South Dakota, Utah, and Wyoming—did not issue orders directing residents to stay at home from nonessential activities in March and April 2020 in response to the coronavirus pandemic. The 43 other states all issued orders at the state level directing residents to stay at home except for essential activities and closing businesses that each state deemed nonessential.” Only South Dakota did not require any businesses to close.

On May 8, 2020, CNBC reported that by the end of the first month of the shutdown, manufacturing had lost 1,330,000 jobs, and its supporting  industry of transportation and warehousing had lost 584,000 jobs, out of the total job loss of 20.5 million. 

Accenture reported: The automotive industry is a critical component of economic growth with extensive interconnections to upstream (e.g. steel, chemicals, textiles) and downstream industries (e.g. repair, mobility services). With nearly 8 million employed in the U.S., employment in the automotive industry has taken a big hit. The automotive industry is considered essential for the global economy and the resulting prosperity.

CNBC reported that the “Aerospace Industries Association estimates that more than 200,000 jobs in the sector are at risk. Boeing earlier this year said it would aim to cut 10% of its workforce, which stood at 160,000 as of the end of 2019. While it is hiring for its defense unit, the commercial aircraft division has been hit by hundreds of cancellations this year, and CFO Greg Smith told investors on July 29 that 19,000 employees are departing Boeing. About 6,000 had left as of the end of June…At General Electric, which makes engines for both Boeing and Airbus planes, the company is cutting a quarter of the jobs, or 13,000 people in its aviation unit, which is based in Ohio.”

An article on PWC.com commented, “On the defense side of the industry, the situation appears less dire, with demand protected by budgeted government spending and a supply chain with minimal exposure to hard-hit jurisdictions such as Asia. However, events outside the US are affecting the US defense industry, as some US military partner nations may experience challenges in military readiness and ability to maintain equipment. Additionally, some defense companies may be financially weakened, but most likely to a lesser extent compared to consumer-facing aerospace companies.”

My manufacturers sales rep agency, ElectroFab Sales, was fortunate in that all of the California companies we represent were able to stay open because they were in the supply chain of one or more of the 16 essential industries allowed to stay open by California Governor Newsome. However, our open sales orders have dropped by 50% since February. This is primarily because too many of  our customers are in the defense and military sector, and all new product development for new systems has been put on hold indefinitely. In addition, repeat orders for existing systems have dropped.

The summer newsletter of the Coalition for a Prosperous America reported: The term ‘Made in USA’ is currently tracking at an all-tie high since 2004” on Google Trends.  Zach Molti of Atlas Tool Works said that “his company’s recent sales are up roughly one-and-a-half times their usual volume.”  “Bryan Hurley, the owner of Florida-based Americraft Cookware says that his sales have been up 167% of late compared to 2019.” Greg Owns, CEO of Liberty Tabletop, the only flatware manufacturer in the U.S., reported on our Buy American Committee call last Thursday, that orders are up 200% compared to 2019.

A number of CPA member companies had retooled and repurposed their operations to respond to the COVID-19 pandemic to make PPE goods and equipment. Numerous other manufacturers all over the country did the same thing.  Even Ford and GM retooled their factories to make ventilators.

Five months after the COVID-19 shutdowns began, manufacturing is bouncing back faster than everyone expedted. The September 1st Manufacturing ISM® Report On Business®  issued  by Timothy R. Fiore, CPSM, C.P.M., Chair of the Institute for Supply Management® (ISM®) Manufacturing Business Survey Committee showed that “The August PMI® registered 56 percent, up 1.8 percentage points from the July reading of 54.2 percent. This figure indicates expansion in the overall economy for the fourth month in a row after a contraction in April, which ended a period of 131 consecutive months of growth. The New Orders Index registered 67.6 percent, an increase of 6.1 percentage points from the July reading of 61.5 percent.  U.S. manufacturing activity came back strong and exceeded expectations for August, expanding at the fastest rate in almost two years.”

However, “…(1) commercial aerospace equipment companies, (2) office furniture and commercial office building subsuppliers and (3) companies operating in the oil and gas markets — as well as their supporting supply bases — are and will continue to be impacted due to low demand. These companies represent approximately 20 percent of manufacturing output. This situation will likely continue at least through the end of the year,” says Fiore.”

In an article on Manufacturing.net, Melvin Bosso, a principal with Myrtle Consulting Group, stated, “Reshoring is also an example of a dynamic that had started long before COVID-19 and will continue far beyond the emotional reaction to the catastrophic effects of the crisis.” He said, there are “four major clusters of reasons why a company makes a decision on how to deploy their supply chains: Costs, Service, Technology and Risk…most organizations have had to rethink their understanding of the fourth cluster – Risk…. All supply chains that run with a just-in-time inventory strategy had to deal with a shortage risk when China, and more broadly Asia, locked down. All essential industries are coming out of the crisis thinking about alternatives. Many are working, or will be working, to find ways to change their exposure.”

Harry Moser, Founder and President of the Reshoring Initiative® recently stated, “COVID has caused companies to reevaluate their supply chains. Often, shorter is better. By 4Q20 we expect to be helping 50 to 100 companies either buy smarter or sell smarter against imports. In most cases, we are providing this support through MEPs (Manufacturing Extension Partnerships) which exist in every state.”

We need to take advantage of this wake-up call to the risk of global supply chains, particularly our reliance on China, to create incentive plans to bring back manufacturing segments that are considered critical for national sustainability. Now is the time to reshore key industries from China to reduce the risk of future supply chain disruptions due to unforeseen events.  American consumers want to buy more “Made in USA” products.  Our government needs to use domestic manufacturing as part of its plan to build up strategic resilience in the aftermath of the current crisis.  It’s time for Congress to support reshoring with the right trade, tax, and currency policies to facilitate making the reshoring trend permanent.

Why Software Should be Made in USA

Tuesday, September 1st, 2020

Our modern world runs on computers and the software that controls them.  Software makes our computers usable for such activities as word processing, accounting, engineering design, production planning, Enterprise Resource Planning (ERP), communication, CGI, 3D printing, teleconferencing, and videoconferencing, not to mention the thousands of Apps for iPhones and Android phones. Software controls many functions of automobiles, trains, boats, ships, and airplanes. If software fails, it can mean the loss of life.  This is why is just as important for software to be Made in USA as it is for manufactured goods.  It is also important for software to be developed in the USA so we can make sure that there is no embedded malware, spyware, or backdoors.

My own manufacturers rep sales agency has been computerized since 1988, and I couldn’t function without my systems. I have also been participating in teleconferencing since 2011 for monthly meetings of  the Coalition for a Prosperous America and giving webinars since 2013 after publishing my second edition of Can American Manufacturig be Saved? Why we should and how we can in 2012.  I have used a variety of programs for videoconferencing, such as Cisco’s Webex, www.GotoWebinar.com, and www.vimeo.com.  Earlier this year I gave a webinar using Zoom. 

After the COVID-19 pandemic hit and shutdowns on nonessential businesses went into effect, many of my customers and prospects started working from home. Many of my customers are in the defense and military supply chain, and my contacts are purchasing agents and engineers. My contacts began to tell me that they were participating in staff meetings using Zoom. The meetings were most likely discussing current contracts and new products in development, but may have included proprietary or classified material.

As the months went by, it became more and more common to hear about Zoom meetings.  I began to wonder how Zoom had taken over the marketplace for videoconferencing from all of the other programs I had previously used. Then, one of my business associates told me that Zoom was allowing people to use its teleconference software for free.  I also heard that Zoom was a Chinese company, but I learned that is not true when I checked it out.

According to Wikipedia, “Zoom Video Communications, Inc. (Zoom) is an American communications technology company headquartered in San Jose, California…Eric Yuan, a former Cisco Webex engineer and executive, founded Zoom in 2011, and launched its software in 2013.”

On April 15, 2020, CNBC reported “Co-founder and CEO Eric Yuan, who previously worked on the Webex video calling product that Cisco acquired in 2007, is the largest individual shareholder of Zoom with 3.9% of the stock’s outstanding shares. He emigrated from China in 1997, when he was 27, CNBC previously reported, but he is a U.S. citizen, according to a December regulatory filing.” The concern about China is probably because CNBC also reported “Zoom’s product development team is based “largely” in China, and it operates research and development centers in that country, according to the company’s most recent annual report.”

Wikipedia explained its exponential growth: “During the COVID-19 pandemic, Zoom saw a major increase in usage for remote work, distance education, and online social relations. Thousands of educational institutions switched to online classes using Zoom. The company offered its services for free to K–12 schools in many countries.”  Chinese companies often sell products at or below cost to take over market share, so Zoom may be following this example. But, I don’t know how any company can afford to give away its product for free unless it is receiving funding from another source.

Regarding Zoom, Wikipedia states “Its software products have faced public and media scrutiny related to security and privacy issues.”  These criticisms cover “security lapses and poor design choices” and “its privacy and corporate data sharing policies.”

An article titled, “Zoom security flaws and Chinese links make US authorities nervous,” on Telecoms news of April 6, 2020, clarifies the connection to China, stating, “the software appears to be developed by three companies in China, all known as Ruanshi Software, only two of which are owned by Zoom. The ownership of the third company, also known as American Cloud Video Software Technology, is unknown. The article states “700 employees are currently in China, which is not unusual as it can save on salaries in comparison to the US, though it does open up the firm to pressure and influence from the Chinese Government.”

This same article reported that Zoom has servers in China that were used by mistake during the initial surge of usage after the COVID-19 pandemic struck. The article’s author, Jamie Davies wrote:

“By default, all participants’ audio and video in a Zoom meeting appears to be encrypted and decrypted with a single AES-128 key shared amongst the participants. The AES key appears to be generated and distributed to the meeting’s participants by Zoom servers. Zoom’s encryption and decryption use AES in ECB mode, which is well-understood to be a bad idea, because this mode of encryption preserves patterns in the input.”

These encryption keys could also be distributed through Chinese servers, which is a bad idea for anyone as companies can be legally compelled by the Government to hand over these keys. Zoom has said this oversight has been corrected and no international meetings will be routed through Chinese servers, but the damage may well have already been done.”

As a result of these concerns, Wikipedia states, “In March 2020, New York State Attorney General Letitia James launched an inquiry into Zoom’s privacy and security practices; the inquiry was closed on May 7, 2020, with Zoom not admitting wrongdoing, but agreeing to take added security measures. Also, in May 2020, the Federal Trade Commission announced that it was looking into Zoom’s privacy practices.

While there is no evidence of wrong-doing on the part of Zoom as of this writing, the fact that their programming is said to be done in China raises troubling security concerns, as programmers in China could easily be pressured by their government to put back doors into the software they write. This is why it is as essential to our national security to keep computer software development in our own country, just as it is important to keep drug development and medical equipment manufacturing in our own country.

Until the FCC investigation is concluded, some security experts are recommending that the President issue an executive order prohibiting the use of Zoom by government agencies, as well as defense contractors to insure no classified or proprietary information is compromised.

What is the Vision for the Factory of the Future?

Tuesday, August 18th, 2020

In April 2017, the Manufacturing Leadership Council published its “Vision 2030:  The Factory of the Future, which was a Frost & Sullivan White Paper sponsored by General Electric and Intel. In their vision, the factory of the future “will look like an integrated hardware and software system and “is highly automated and information-intensive… fueled by vast quantities of information from every corner of the enterprise and beyond, moderated by analytical systems that can identify and extract insights and opportunities from that information, and comprised of intelligent machines that learn, act, and work alongside highly skilled human beings in safe and collaborative environments.”

The key trends and developments of the factory of the future were identified as:

  • “Digitization  – transforming how manufacturers think about human capital management”
  • “Modularization, with micro factories capable of mass customization using such technologies as 3D printing as well as digital manufacturing technologies”
  • “Manufacturing innovation process will evolve to be more open and extended, with collaborative models that span internal as well as external constituencies”
  • “Supply chains will become highly integrated, increasingly intelligent, and even self-managing”
  • “New business models incorporating outcome-based services will emerge, enabling manufacturers to diversify their revenue streams and provide greater value to customers”
  • “Cognitive computing and analytic techniques will enable production environments to self-configure, self- adjust, and self-optimize, leading to greater agility, flexibility, and cost effectiveness”

The paper also identified four categories of “Mega Trends” that will have implications for manufacturers over the next 15 years:

  • Globalization/Urbanization/Regionalization/Uncertainty:  Global economic forces are “creating shifts in how manufacturers must think about how they design their production and supply networks. As globalization provokes responses such as the erection of trade barriers and as urbanization and the growth of regional economies lead to a demand for localized products and rising labor costs even in previously low-cost areas, manufacturers must continuously recalibrate where and how they produce, whether they outsource, and how they serve emerging markets”
  • Smart/Material/Open/Green: New, smart approaches to innovation…focus on waste reduction fueled by innovations in material science, open systems, and new forms of social collaboration.”
  • Business Model Innovations: Technology forces are transforming the industrial world. “Smart, connected products and real-time analytics will allow manufacturers to sell outcomes-such as jet engine uptime-not just products. This means manufacturers will need to fundamentally rethink their relationships with customers. It also means they will face an entirely new competitive landscape.”
  • Ambient Intelligence: “Advances in technologies such as cloud-based solutions, digital platforms and applications, machine learning, and the Internet of Things are combining to provide all institutions with the unprecedented ability to gain and act on insights.”

Within the Mega Trends, there are “four major themes and eight sub-themes that, taken together, will transform the manufacturing landscape over the next 10-15 years.”  The four major themes are:

Intelligent Design – “personalization and mass customization of products and the location of production closer to the point of consumption”

  • Federated Manufacturing – “Networks of smaller, more nimble factories”
  • Smart Innovations – integrated product design, production, and support processes”  

Services Revolution – “from product-as-a-service to anything-as-a-service model”

  • New Value Networks – “Suppliers will transform from providers of parts to partners in “as-a-service” business models”
  • Outcome-based – “services sold on the basis of usage and guaranteed outcomes”

Platform Revolution – “connected platforms will allow machine learning of a different order…will unleash an era of cognitive learning and improvements.”

  • Connected Platforms – “Enabled by IoT and cloud technologies as well as advanced, real-time analytics, products will become connected platforms, featuring a range of services that will deliver new revenue sources.”
  • Cognitive Platforms – “Connected products-or platforms-will collect vast quantities of usage, performance, and diagnostic data that can be used to improve next-generation designs.”

Human-to-Machine Convergence (Artificial intelligence advancements and robotic process automation)

  • Machine Dominance – “evolving as robots transition from being programmed only to execute repetitive tasks to being collaborative and even sentient”
  • Human Capital Transformation – …manufacturers must clearly define the skills that will be required, take an inventory of current capabilities, and provide tools that enable self-training and skills certification.”

Each of these themes and sub-themes are expanded upon in detail in the body of the paper leading to the authors conclusion that “The general outlines of what future factories and plants will look like are now discernable. They will be organized for greater speed, flexibility, productivity, and efficiency. The people who work in them will be highly skilled about advanced digital technologies and able to work cross-functionally across the connected enterprise…rapidly changing and increasingly sophisticated information and operational technologies are facilitating a shift to mass customization, from mass production, making it possible to satisfy individual needs from transportation to medicine.”

When this paper was published, I was finishing the last chapters of my book Rebuild Manufacturing – the key to American Prosperity, published in September 2017.  While I agree with many of the trends, themes, and subthemes of the paper, I completely disagree with their conclusion that “the globalization of manufacturing, powered by the relentless march of technology, will continue…” 

In my chapter, “Advanced Technology is critical to Rebuilding American Manufacturing,” I discuss how “advanced industries” are utilizing new technologies, such as artificial intelligence, robotics, 3-D printing/ additive manufacturing, the “digitization of everything, machine learning, and Internet of things (IoT).  As a result, American companies are able to be more competitive in the global market place with domestic production and are returning manufacturing to America through reshoring.  The trend of mass production converting to mass customization and the regionalization of manufacturing and creation of manufacturing networks will also increase the ability of American manufacturers to be able to reshore manufacturing to the USA.

In a Forbes article of Apr 7,2020, “New Data Shows U.S. Companies Are Definitely Leaving China”  Kenneth Rapoza wrote, “U.S. companies are leaving China thanks to the trade war. They’ll leave even more thanks to the pandemic…Last year saw companies actively rethinking their supply chain, either convincing their Chinese partners to relocate to southeast Asia to avoid tariffs, or by opting out of sourcing from China altogether.”

As a director on the board of the San Diego Inventors Forum and as a mentor for CONNECT’s Springboard Program, I have seen how 3D printing/additive manufacturing can accelerate the development of a new product and  enable inventors to have a sample product to show/demonstrate in person or by means of a video to secure potential investors. A 3D printed prototype can be the essential ingredient of a video to do a crowdfunding campaign via Kickstarter or Indiegogo or seek investors. 

I conclude my chapter by saying, “The increased efficiency of additive manufacturing/3-D printing, IoT, and automation/robotics could spell a bright future for American manufacturing. The shift to smart manufacturing using these new technologies will save our corporations money and translate into greater profits, more jobs, and more prosperous economies, locally and nationally. As our manufacturing industry moves into a more complex age, so will our workers and products, ushering in a new era of production.

U.S. Must Stop Trafficking of Counterfeit and Pirated Goods

Tuesday, August 4th, 2020

One of the dangers of reliance on foreign manufacturers is the increase of U.S. vulnerability to receiving counterfeit goods.  Over the last ten years, there have been several reports prepared to determine the extent of the infiltration of counterfeits into U.S. defense and industrial supply chains, to provide an understanding of industry and government practices that contribute to the problem, and to identify best practices and recommendations for handling and preventing counterfeit electronics.

The first was the Defense Industrial Base Assessment: Counterfeit Electronics prepared by the U.S. Department of Commerce on January 2010as a result of a three-year study. “This assessment focused on discrete electronic components, microcircuits, and circuit board products – key elements of electronic systems that support national security, industrial, and commercial missions and operations. A few of the findings of the study were:

  • all elements of the supply chain have been directly impacted by counterfeit electronics
  • companies and organizations assume that others in the supply chain are testing parts;
  • lack of traceability in the supply chain is commonplace
  • there is an insufficient chain of accountability within organizations
  • recordkeeping on counterfeit incidents by organizations is very limited
  • most DOD organizations do not have policies in place to prevent counterfeit parts from infiltrating their supply chain

The Bureau of Industry and Security’s (BIS) Office of Technology Evaluation (OTE) made the following key recommendations:

  • Consider establishing a centralized federal reporting mechanism for collecting information on suspected/confirmed counterfeit parts for use by industry and all federal agencies
  • Modify Federal Acquisition Regulations (FAR), including Defense Federal Acquisition Regulations (DFAR), to allow for “best value” procurement
  • Require U.S. Government suppliers and federal agencies to systematically report counterfeit electronic parts to the national federal reporting mechanism;
  • Issue clear, unambiguous legal guidance to industry and U.S. federal agencies with respect to civil and criminal liabilities, reporting and handling requirements
  • Establish federal guidance for the destruction, recycling, and/or disposal of electronic systems and parts sold and consumed in the United States
  • Consider establishing a government data repository of electronic parts information and for disseminating best practices to limit the infiltration of counterfeits into supply chains
  • Develop international agreements covering information sharing, supply chain integrity, border inspection of electronic parts shipped to and from their countries, related law enforcement cooperation, and standards for inspecting suspected/confirmed counterfeits

However, implementing these recommendations didn’t solve the problem.  On May 21, 2012, the U.S. Senate Armed Services Committee released a report as a result of a congressional investigation into counterfeit goods.  “The year-long investigation launched by Sen. Carl Levin, D-Mich., the committee’s chairman, and Ranking Member Sen. John McCain, R-Ariz., found a total number of suspect counterfeit parts involved in those 1,800 cases exceeding 1 million.” Counterfeit electronic parts “were uncovered in items ranging from night vision equipment to Global Positioning System (GPS) navigation modules.”

The Committee “discovered counterfeit electronic parts from China in the Air Force’s largest cargo plane, in assemblies intended for Special Operations helicopters, and in a Navy surveillance plane among 1,800 cases of bogus parts.

“Our report outlines how this flood of counterfeit parts, overwhelmingly from China, threatens national security, the safety of our troops and American jobs,” Levin said. “

As a result, “the Committee adopted an amendment to the FY12 National Defense Authorization Act (NDAA) to “address weaknesses in the defense supply chain and to promote the adoption of aggressive counterfeit avoidance practices by DoD and the defense industry.”

In the next four years, progress was made as shown by the follow-up report to Congress of February 2016 Government Accountability Office (GAO), which  “found that while the number of counterfeit parts in the DoD supply chain decreased significantly between 2011 and 2015, there were still nearly 50 parts per year that were identified as being counterfeit.  As a percentage of total parts, this was a mere .006% of the DoD supply chain.”

However, a single counterfeit part can have a disastrous impact and identifying counterfeit parts is extremely difficult when they are deliberately manufactured to pass as the “real deal.” Moreover, the threat of counterfeit parts being introduced by U.S. adversaries, such as China, has increased, and these foreign companies are good at figuring out ways to make their counterfeits blend in with other components.

Counterfeit goods are not limited to the defense and industrial supply chain.  The January 24, 2020 report to the President of the United States, “Combating Trafficking in Counterfeit and Pirated Goods,” states, “Counterfeiting is no longer confined to street-corners and flea markets. The problem has intensified to staggering levels…information collected by the U.S. Department of Homeland Security (DHS) between 2000 and 2018 shows that seizures of infringing goods at U.S. borders have increased 10-fold, from 3,244 seizures per year to 33,810.”

This report recommended the following immediate actions for the Department of Homeland Security and other agencies:

1.” Ensure Entities with Financial Interests in Imports Bear Responsibility

2. Increase Scrutiny of Section 321 Environment

3. Suspend and Debar Repeat Offenders; Act Against Non-Compliant International Posts

4. Apply Civil Fines, Penalties and Injunctive Actions for Violative Imported Products

5. Leverage Advance Electronic Data for Mail Mode

6. Anti-Counterfeiting Consortium to Identify Online Nefarious Actors (ACTION) Plan

7. Analyze Enforcement Resources

8. Create Modernized E-Commerce Enforcement Framework

9. Assess Contributory Trademark Infringement Liability for Platforms

10. Re-Examine the Legal Framework Surrounding Non-Resident Importers

11. Establish a National Consumer Awareness Campaign”

These recommendations were very timely since there has been a big problem with counterfeit pharmaceuticals, personal protective equipment (PPE), and medical devices during the COVID-19 pandemic this year. Counterfeit goods in the healthcare industry can cause immediate loss of lives just like counterfeit parts in the defense industry can cause loss of life for our military personnel in defending our country.

Since taking office in January 2017, President Trump has issued three Executive Orders strengthening different aspects of the Buy American Act of 1933: 

EO 13788: “Buy American and Hire American,” April 18, 2017

EO 13858: Strengthening Buy-American Preferences for Infrastructure Projects,” January 31 2019

EO 13881:– “Maximizing Use of American-Made Goods, Products, and Materials,” July 15, 2019

I laud the President’s focus on strengthening the Buy American Act, but the best way to eliminate the problem of counterfeit goods is to return manufacturing to America of all critical goods for our defense and military, as well as our pharmaceutical, PPE, and medical device industries.  This is referred to as “reshoring” by Harry Moser, who founded the Reshoring Initiative in 2010. In an article for Assembly magazine of February 12, 2019, Harry Moser wrote: “The Reshoring Initiative has aggregated consumer surveys from 10 sources, gleaning insight into the preferences of more than 14,000 U.S. consumers. Findings show that there is a decisive preference for U.S.-made goods: 97 percent have a positive view of goods manufactured in the U.S. Americans also have a positive opinion of companies that manufacture in the U.S.: 91 percent believe it is important to manufacture in the U.S. and think the government should take steps to support American manufacturing.”

Only Made in USA products will be able to provide confidence in the quality of the products, but government agencies, the health care industry, and consumers need to know where products are being made to make the choice of buying Made in USA products. Currently, there are limitations of county of origin labeling on products, and no information is provided for products sold on the internet and through catalogs.  We must address this situation if we are truly going to be able to stop trafficking of counterfeit and pirated goods. 

Manufacturing Generates Exports

Tuesday, June 23rd, 2020

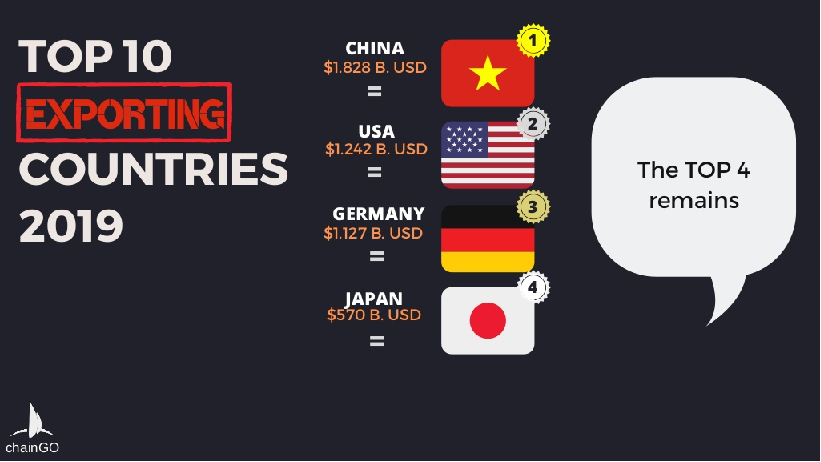
The third reason why manufacturing is important is that the United States is still a top leader in generating manufacturing exports. The U.S. was the world’s largest exporter until 1992, when Germany took over this position. The U.S. maintained a position as the second-highest exporter, until China surpassed it in 2008. Germany remained number one until 2009, when China surpassed it to become the world’s top exporter. The U.S. overtook Germany as the second-highest exporter in 2014. The latest data for world exports is from 2019 when China’s exports totaled $1.8 trillion, down from $2.49 trillion in 2018; the U.S. exports totaled $1.24, down from $1.66 trillion in 2018, and Germany’s exports were $1.12, down from $1.55 trillion in 2018.

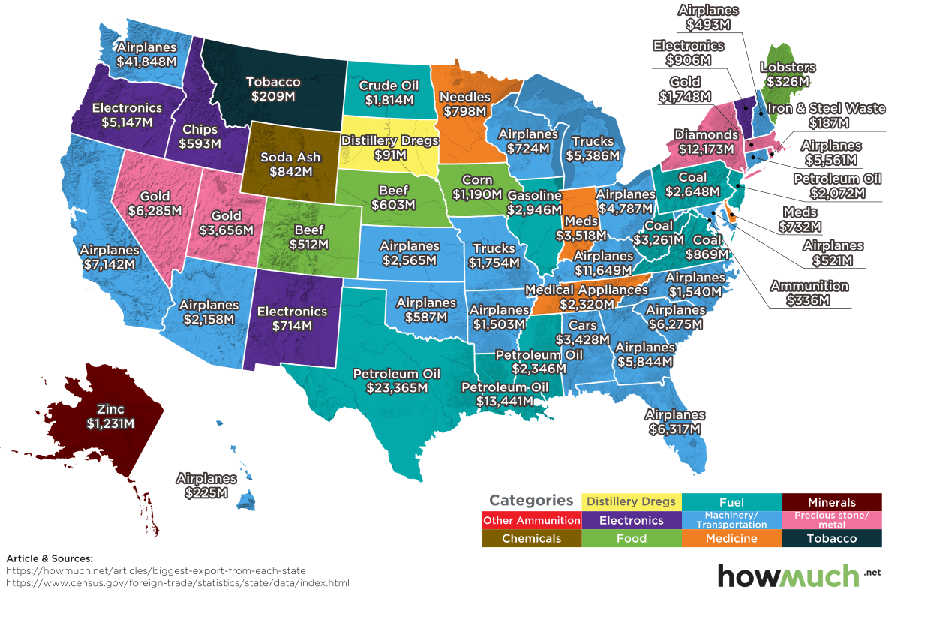
According to a 2020 report on exports: ”The following export product groups categorize the highest dollar value in American global shipments during 2019. Also shown is the percentage share each export category represents in terms of overall exports from the United States.

  1. Machinery including computers: $205.9 billion (12.5% of total exports)
  2. Mineral fuels including oil: $199.7 billion (12.1%)
  3. Electrical machinery, equipment: $173.2 billion (10.5%)
  4. Aircraft, spacecraft: $136 billion (8.3%)
  5. Vehicles: $133 billion (8.1%)
  6. Optical, technical, medical apparatus: $90.8 billion (5.5%)
  7. Plastics, plastic articles: $64.9 billion (3.9%)
  8. Gems, precious metals: $59.6 billion (3.6%)
  9. Pharmaceuticals: $53.6 billion (3.3%)
  10. Organic chemicals: $39.3 billion (2.4%)

America’s top 10 exports surpass well over two-thirds (70.3%) of the overall value of its global shipments.”

Manufactured goods “make up more than 66% of U.S. exports…One-third of exported goods are capital goods double the level of 20 years ago… Only 12% of U.S. exported goods are consumer goods…Just 8% of exported goods are foods, feeds, and beverages ($131 billion). The big three are soybeans ($20 billion), meat and poultry ($20 billion), and corn ($9 billion).”

According to the U.S. Small Business Administration, small- and medium-sized enterprises (SMEs) comprised 97 percent of all identified U.S. exporters, generated 64 percent of net new jobs between 1992 to 2009, and represented 31 percent of U.S. export value in 2008. About 65 percent of all U.S. exports come from small businesses with fewer than 20 employees.

Exports of manufactured goods is important to the economies of most states – even in those areas where manufacturing has declined as a portion of the Gross State Product (GSP).  

The top five U. S. export markets:

  • Canada
  • Mexico
  • China
  • Japan
  • United Kingdom

Both President Bush and President Obama had the goal of doubling U.S. exports during their administrations. President Obama even established the Export Promotion Cabinet by Executive Order 13534 On March 11, 2010 and tasked them with a plan to achieve the goal of doubling U.S. exports in five years that he had presented in his 2010 State of the Union address. 

The National Export Initiative (NEI) Executive Order had five components: improve advocacy and trade promotion, increase access to export financing, remove barriers to trade, enforce current trade rules, and promote strong, sustainable, and balanced growth.

The NEI identified eight priorities for the plan, and the Export Promotion Cabinet developed recommendations to address each of these priorities, which covered all five components, cut across many federal government agencies, and focus on areas where concerted federal government efforts can help lift exports.

It was no surprise to me that the plan to double exports in five years was unsuccessful because we are fighting against the predatory mercantilism of countries such as China, India, and Japan. The biggest problem is that the United States is no longer the manufacturing source for consumer and household goods and commodities that it once was. American brands such as IBM, General Electric, and Maytag were known worldwide for their quality and innovation. These types of products are now being made in Asia, mostly in China, and imported by the United States and other countries for their consumers to buy rather than being manufactured in the United States for export worldwide.

The majority of manufacturers that were able to survive the great stampede to offshore manufacturing to China don’t produce a finished product; they are the Tier 2, 3 and 4 suppliers that produce components, parts, and assemblies for Original Equipment Manufacturers. Thus, they don’t have a product to sell for export.  I have been representing this type of company as a manufacturers’ sales rep for over 30 years. Most of these companies do not have engineering staff to design a complete product and don’t have the capability to market a product internationally. 

I’ve been working with inventors and entrepreneurs of start-up companies for years to help them select the processes and sources for their new products.  As a director on the board of the San Diego Inventors Forum, I give a presentation of how to select the right processes and sources for a new product as part of our annual curriculum at our monthly meetings in our program of helping inventors go from product design to market.

If we want to increase our manufacturing exports, we need to help inventors and entrepreneurs develop their products and get them to market.  Additive manufacturing has enabled inventors and entrepreneurs to produce low cost prototypes rapidly here in the U.S. The biggest hurdle is to fund the tooling needed to manufacture their products at production volume levels. For advanced technologies that require research and development, there are government funded Small Business Research Grants that enable small start-up companies boot strap their product development.  Perhaps, we can create a grant program for inventors and entrepreneurs to fund the tooling and initial production runs of new products. 

Remember, Albert Einstein is widely credited with saying, “The definition of insanity is doing the same thing over and over again, but expecting different results.” We aren’t going to increase exports by doing the same things we have been doing for the past 20 years.

Manufacturing Jobs Pay Higher Wages than Retail or Service Jobs

Tuesday, June 9th, 2020

Continuing my series on why manufacturing is important to America, the second reason is that wages and benefits for manufacturing jobs are approximately 21 percent higher than for non-manufacturing jobs.

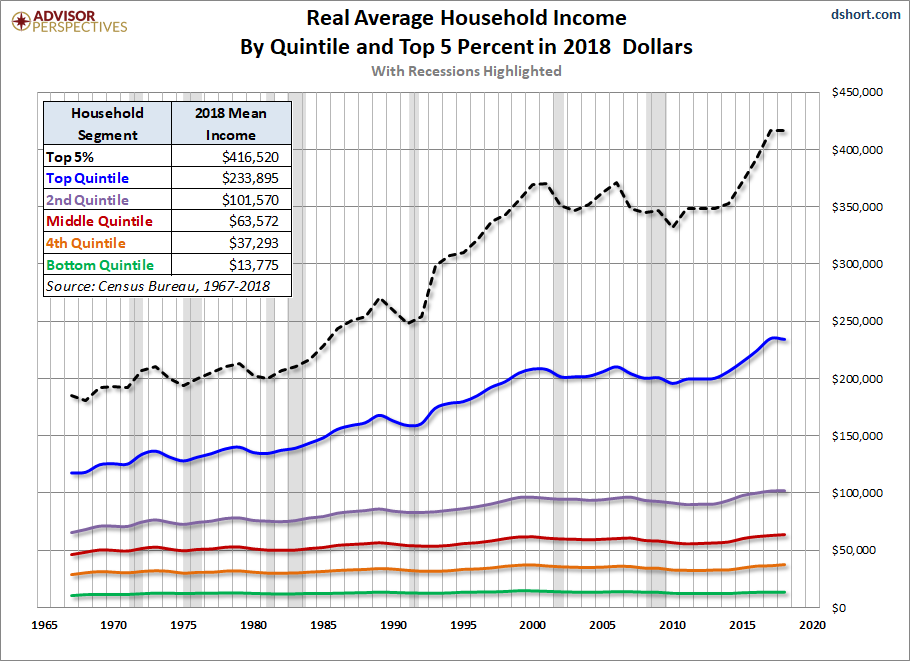
As manufacturing jobs have declined over the past 40 years, the difference between the lowest personal income and highest personal income has steadily grown wider.

This difference was projected to get even worse according to data from the U.S. Department of Labor Occupational Outlook for 2018-2028. Employment growth was projected to continue to be concentrated in the service-providing sector of the economy.

  • “The service-providing sector as a whole will grow at a projected rate of 0.6 percent annually, slightly faster than the annual rate of 0.5 percent for industry employment overall. This growth is projected to add more than 7.6 million jobs, resulting in 136.8 million jobs in the service-providing sector by 2028. After declining slightly from 2008 to 2018 (-0.3 percent annually), the goods-producing sector is expected to change little from 2018–28, with an annual growth rate of 0.1 percent.
  • The sectors projected to experience the fastest annual employment growth are health care and social assistance (1.6 percent), private educational services (1.2 percent), and construction (1.1 percent). These three sectors alone are projected to add more than 4.6 million jobs by 2028—including 3.4 million new jobs projected in healthcare and social assistance.”

In an opinion article in IndustryWeek magazine, John Madigan, a consultant with Madigan Associate, wrote:

“Jobs paying $20 per hour that historically enabled wage earners to support a middle-class standard of living are leaving the U.S. Public sector aside, only 16% of today’s workers earn the $20-per-hour baseline wage, down 60% since 1979.  Service and transportation jobs, per se, cease to exist in the absence of wealth. Rather, they exist and thrive as by-products of middle-class incomes buying products and services.” (source)

According to Facts about Manufacturing by The Center for Manufacturing Research of The Manufacturing Institute, “In 2018, the average manufacturing worker in the United States earned $87,185 annually, including pay and benefits. The average worker in all nonfarm

industries earned $68,782.  Looking specifically at wages, the average manufacturing worker earned more than $27 per hour, according to the latest figures, not including benefits.”

According to the IndustryWeek 2018 Salary Survey, the average salary for manufacturing management is $110,200. By industry sector, the salary ranged from a low of $88,500 in the textiles/apparel sector to a high of $142,500 in the medical device/lab equipment sector.

The 2018 Manufacturing Compensation Report, sponsored by the SME Education Foundation and the Arconic Foundation, “found an average compensation of $64,014 for hourly workers and $111,731 for salary workers, including base pay, bonus/commission and dividends/stock options/profit sharing, and such perks as a company car and mobile phone. Following the trend in the rest of the country, 68 percent of hourly workers and 73 percent of salary workers reported a wage increase in the last year.”

In this report, Christopher Barger, senior director of communications at SME, said, “There are multiple paths to success and good-paying careers at all levels of manufacturing, and the good news is these jobs are in high demand. Individuals who pursue a career in manufacturing have several options to gain solid training education, be it entering the workforce from high school through apprenticeships or internships, attending a vocational school and getting certifications, or attending community colleges, and obtaining associates or four-year degrees.”

Most people have no idea of the variety of jobs that are available at manufacturing companies. Besides the usual corporate/executive management jobs, some of the other management jobs available at medium to large manufacturers are in these areas: operations, plant/facilities, manufacturing/production, purchasing/procurement, sales/marketing, quality, supply chain, lean/continuous improvement, human resources, R&D/product development, and safety/ regulatory compliance.

If you have the opportunity to visit the modern manufacturing facilities in the U. S., you would see the most productive, highly skilled labor force in the world applying the latest in information, innovation, and technology. Contrary to popular opinion, the industrial age is not over. We are in the midst of incredible advances in manufacturing – from nanotechnology, Industrial Internet of Things, robotics, artificial intelligence, and biotechnology.

The innovation found in the manufacturing industry has helped to increase economic productivity too. Since the Industrial Revolution, the way we produce and consume goods has drastically changed, and it is continual innovation that allowed and continues to allow our country to become increasingly more productive in the services offered.

Automation and robotics have helped keep American manufacturers not only competitive but the most productive in the world. Manufacturing has long led U.S. industries in productivity growth. Gains in productivity raise a country’s standard of living. In the past 20 years, productivity – output per hour – has more than doubled – actually 2.5 times – that of other economic sectors.

There is also a multiplier effect of manufacturing jobs that reflects linkages that run deep into the economy. For example, every 100 steel or automotive jobs create between 400 and 500 new jobs in the rest of the economy. This contrasts with the retail sector, where every 100 jobs generate 94 new jobs elsewhere, and the personal and service sectors, where 100 jobs create 147 new jobs. In addition, for every $1.00 spent in manufacturing, another $2.74 is added to the economy. Thus, this economic data indicates that each manufacturing job creates three to four other jobs, while service jobs only create one to two other jobs.  

Thus, manufacturing is an important vehicle to grow and sustain a higher standard of living for our nation, our states, cities, communities and individual families. The higher wages of manufacturing jobs contribute to a better quality of life while ensuring that we have a strong domestic manufacturing sector to protect the health and welfare of all Americans as well as protect our national security. 

Why Manufacturing is Important to America

Wednesday, May 27th, 2020
This week’s article begins a series of short articles on why manufacturing is important to the America economy. Our country’s Founding Fathers recognized the importance of developing a domestic manufacturing base instead of continuing to rely on imports from England, France, and the Netherlands.  They established the U.S. patent system and protected the developing manufacturing industry with tariffs to discourage imports.  This allowed the United States to be the world’s number one manufacturer for more than 100 years, accounting for as much as 25 percent of global manufacturing output in 2007. In 2010, China overtook the U.S. to become the world’s top manufacturing country by output. 
The first reason why manufacturing is important is:  Manufacturing Supplies Millions of Jobs

Manufacturing is the engine that drives American prosperity and is the foundation of the U.S. economy and the basis for its middle class. In February 2020, manufacturing employed 12.6 million workers. According to the National Association of Manufacturers’ facts about manufacturing, “manufacturers contributed $2.381 trillion to the U.S. economy in the fourth quarter of 2019, a new all-time high…Overall, manufacturing accounted for 11% of GDP in the economy.”

In addition, “For every $1.00 spent in manufacturing, another $2.74 is added to the economy. That is the highest multiplier effect of any economic sector. In addition, for every one worker in manufacturing, there are another five employees hired elsewhere.”

The U.S. lost 5.8 million jobs in manufacturing from the year 2000 to 2010 due to a combination of factors, such as the offshoring of jobs to Asia, especially to China, increased productivity of American workers, automation, and robots, as well as the domestic outsourcing of service jobs within a manufacturing company, such as accounting and payroll services, janitorial services, cafeteria/food services, and legal departments. Thus, jobs that may have been classified as manufacturing are now classified as service jobs.

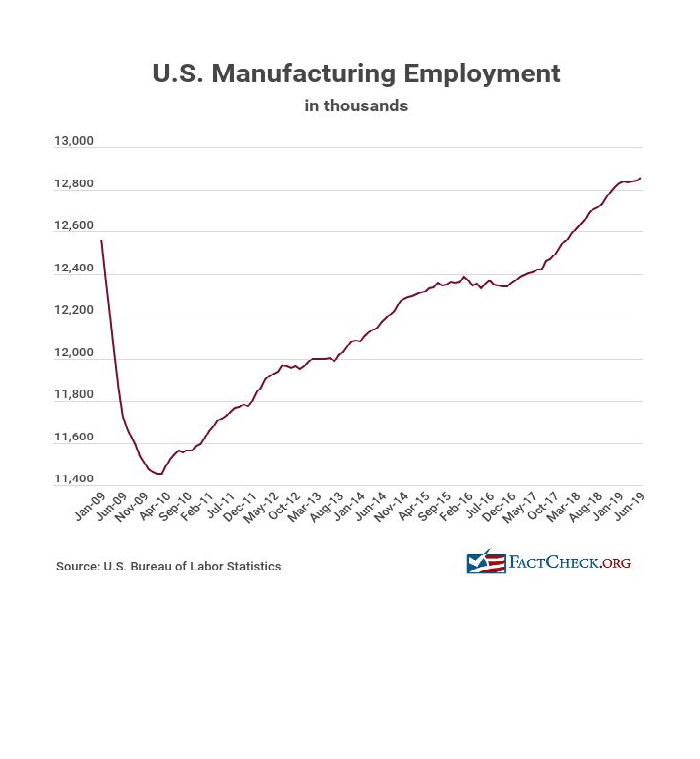
The below chart shows that the U. S. has regained about 1.5 million jobs since the end of the recession. 

American workers achieve a high productivity rate year in and year out, and the growing trend of training in “Lean manufacturing” has accelerated the increase in the productivity of American workers

In 2019, the ten states with the largest manufacturing workforces were:  California, Texas, Ohio, Michigan, Illinois, Pennsylvania, Indiana, Wisconsin, South Carolina, and New York. California’s manufacturing workforce of more than 1.2 million exceeds Illinois and Pennsylvania’s combined manufacturing workforce

A blog article by Alex Carrick of January 14, 2019 on the website www.constructconnect.com, states:  “The five major contributors to U.S. manufacturing employment are:  transportation equipment, a 13.2% share; food manufacturing, 12.9%; fabricated metal products, 11.7%; machinery, 8.9%; and computer and electronic products, 8.4%.

Michigan (with an 11.4% share) leads all states in number of transportation equipment jobs. It’s followed by Indiana (8.2%). California and Ohio (each with 7.3% shares) are tied for third.

By a wide margin, California is out front among states in number of food manufacturing jobs.

California and Texas provide the most ‘fabricated metal product’ jobs; Ohio is in third spot.

Texas, which is big in oil and gas drilling equipment, is the nation’s leader in machinery manufacturing jobs.

More than a quarter of U.S. ‘computer and electronic products’ manufacturing jobs are in California. Second-place Texas has only about one-third of California’s contingent.”

The sooner we reopen all manufacturing, instead of just allowing manufacturers in critical industries to remain open, the sooner we will get millions of manufacturing workers off the unemployment roles and back to producing the goods we need to remain a strong industrial nation, while protecting the health and national security of all Americans.