Posts Tagged ‘loss of manufacturing jobs’

Blacks & Hispanics Suffer from Loss of High Paying Manufacturing Jobs

Tuesday, June 1st, 2021

On May 24th, the Coalition for a Prosperous America released a new working paper, “Job Quality Index for Black, Hispanic and Asian American workers.  In this working paper, Jeff Ferry, CPA Chief Economist, and Amanda Mayoral, CPA Economist, present Job Quality Indexes for three important minority groups within the U.S. workforce: Asian, Black, and Hispanic Americans.

In November 2019, CPA published the first U.S. Private Sector Job Quality Index (JQI) report in partnership with Cornell Law School, The JQI “measures the quality of U.S. jobs as distinct from their quantity” using Bureau of Labor Statistics (BLS) data to calculate the average weekly wage for all Production and Nonsupervisory (P&NS) employees. These workers “make up 80% of the total U.S private sector workforce, 98 million out of a total 122 million workers.”

“The JQI is the ratio of high-quality jobs to low-quality jobs, multiplied by 100 and expressed as an index. By calculating the national average weekly wage for all P&NS employees, we can establish a threshold to split high- and low-quality jobs. The jobs in all sectors delivering a weekly wage above the threshold are termed high quality and all jobs below the threshold are low quality. The average weekly wage, or threshold, as of December 2020 was $857.60.”

Since its inception, the “JQI shows that the U.S. creates millions more low-quality jobs than high-quality jobs each year. The JQI for December 2020 was 80.5, indicating that 55% of nonsupervisory workers worked in low-quality jobs, and only 45% in high-quality.”

The results of the new working paper “show that Black and Hispanic American Job Quality Indexes are far below that for the total U.S. population. Asian American JQI however is substantially higher than the overall U.S. JQI.  The key findings were:

  • “Black American job quality is far worse than that of the total population. The Black Job Quality Index (JQI) for 2020 was 38.7, more than 40 points below the JQI for the total U.S. private sector production and nonsupervisory workforce. For the Black nonsupervisory workforce, 72% of their jobs are low quality, and only 28% rank as high-quality…”
  • The JQI for Hispanic Americans was 38.1 in 2020, 42 points below the U.S. JQI. In 2002, 28% of Hispanic American employees held high-quality jobs and 72% were in low-quality employment. Although far below the U.S. JQI, the Hispanic American JQI rose by 29% since 2007, when it was just 29.5. The increase in the Hispanic American JQI was driven largely by the growth of Hispanic jobs in high-quality health care and construction service jobs.
  • The Asian American JQI began the period well above the total U.S. figure and rose further, to reach 158.3 in 2020. At that level, 61% of Asian American employees were in high-quality jobs, with just 29% in low-quality. The high and rising Asian American JQI was driven by high-quality professional business service, health care, and finance/insurance jobs.

Ferry and Mayoral offered the following opinion: “Despite rising incomes for many Americans since 2007, Black Americans are not getting their fair share. Job growth for Black Americans since 2007 has been concentrated in low-quality jobs, notably in service sector jobs such as food service and social assistance. The slow growth in high-quality jobs since 2007, including a decline in many manufacturing sectors, has made it more difficult for Black and Hispanic Americans to gain access to these jobs. The JQIs for Black and Hispanic Americans reflect the economic inequality faced by these groups.”

They added, “The changing composition of the U.S. workforce in the years since 2000 hits Black Americans harder than it hits other ethnic groups, in particular whites, because Black Americans are more strongly concentrated among the 64% of the U.S. workforce that does not have a four-year college degree. For workers without four-year degrees, the traditional route to a middle-class income has been the manufacturing sector. That sector’s abrupt decline, which began in the 1980s but accelerated after 2000, has forced these workers to look elsewhere for employment. Unfortunately, the service sectors where jobs have grown most rapidly in this century pay well below manufacturing wages.”

It wasn’t “systemic racism” that caused the loss of higher paying manufacturing jobs —it was the greed of large American corporations with multinational presence that wanted to increase profits by shifting manufacturing to cheaper labor countries reduce costs of regulations.  Manufacturing was first shifted to Mexico after NAFTA and then to China after China was allowed into the World Trade Organization in the year 2000 and tariffs were reduced or eliminated. The loss of manufacturing jobs was made worse by   China’s flooding the U.S. with cheap imports that put domestic manufacturers out of business. 

The loss of high paying manufacturing jobs in cities like Detroit, Chicago, Philadelphia, and Pittsburgh, all cities with high Black populations, turned these cities and others into “job deserts” for high paying jobs.

When I visited Cincinnati in 2016 as the guest of Source Cincinnati, I learned that the city had lost 67% of its manufacturing base, and they were implementing a multi-pronged approach to reviving manufacturing jobs. Some cities in the southern states of North and South Carolina lost nearly all of their textile and furniture manufacturers. In 2017, I saw evidence of this devastation when I visited Greensboro, Raleigh, and High Point in North Carolina and Charleston, South Carolina.

Even in my long-time home of San Diego County, I documented the loss of 185 companies out of my database of about 1,000 manufacturers between 2001 and 2010. I wrote periodic reports starting in 2003, which led me to write my first book, Can American Manufacturing be Saved” Why we should and how we can” published in 2009.  This edition and the 2012 edition described the ramifications of losing 5.8 million manufacturing jobs in the U.S. between 2001 – 2010 and made recommendations on how to save American manufacturing.

In conclusion, Ferry and Mayoral recommended: “Policy initiatives to address the inequality of Black and Hispanic Americans suffering from much lower job quality than the total American population include supporting high-wage industries, notably manufacturing. These industries offer the best opportunity for Black and Hispanic Americans, who have relatively less educational qualifications than other Americans, to find high-quality jobs capable of supporting middle class lifestyles.”

Addressing the problem of rebuilding American manufacturing to create more high paying jobs for all Americans, including Black and Hispanic workers, is the whole focus of my book, Rebuild Manufacturing – the key to American Prosperity published in 2017. Reshoring manufacturing to America and personal decisions by consumers to buy Made in USA products are just two of the simpler ways we can rebuild American manufacturing.
Reshoring of Manufacturing Increases in 2020

Wednesday, December 23rd, 2020

The United States gradually lost manufacturing jobs from the peak of 19.5 million in 1979 to 17.3 million by early 2000.  However, after China was granted Most Favored Nation status that year, the loss of manufacturing jobs in the U.S. accelerated dramatically as American manufacturers moved manufacturing offshore and cheaper Chinese goods drove U.S. manufacturers out of business. According to the Bureau of Labor Statistics, we lost 5.8 million manufacturing jobs from the middle of the year 2000 to the middle of 2010.  Fortunately, we have been slowly regaining manufacturing jobs since 2010 thanks to a great extent to the efforts of the Reshoring Initiative.

In April 2010, the Reshoring Initiative was founded by Harry Moser, retired president of GF AgieCharmilles LLC, a leading machine tool supplier in Lincolnshire, Illinois.to facilitate returning manufacturing to America from offshore by providing the right tool at the right time to with the creation of the Total Cost of OwnershipTM  worksheet calculator spreadsheet. To help companies make better sourcing decisions, the Reshoring Initiative provides the Total Cost of OwnershipTM  spreadsheet for free to help manufacturers calculate the real impact offshoring has on their bottom line. The website provides an online library of more than 7,000 articles about cases of successful reshoring.

The brief definition of TCO is an estimate of the direct and indirect costs related to the purchase of a part, sub-assembly, assembly, or product. However, a thorough TCO includes much more than the purchase price of the goods paid to the supplier. For the purchase of manufactured goods, it should also include all of the other factors associated with the purchase of the goods, such as:  geographical location, transportation alternatives, inventory costs and control, quality control, as well as reserve capacity, responsiveness, and technological depth of the vendor.

Mr. Moser’s TCO spreadsheet includes calculations for the hidden costs of doing business offshore, such as Intellectual Property theft, danger of counterfeit parts, the risk factors of political instability, natural disasters, riots, strikes, technological depth and reserve capacity of suppliers, and currency fluctuation as well as effect on innovation, product liability risk, annual wage inflation, and currency appreciation.

Previous studies have shown that about 60% of companies made the decision to offshore based on comparing wage rates, FOB prices or landed costs, while ignoring the hidden costs and risk factors. Thanks to the Reshoring Initiative’s TCO worksheet, companies are becoming familiar with the broad range of factors they had previously ignored. The reasons that thousands of other companies have given for reshoring in the Reshoring Initiatives library of cases helps companies to determine whether those reasons are applicable to them.

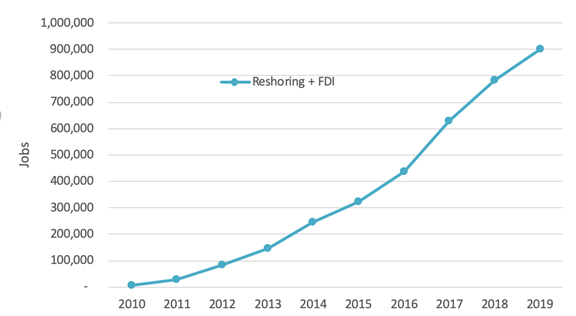
According to the annual report released on December 7, 2020 by the Reshoring Initiative, “The projected job announcements for 2020 is 110,000, which will bring the total to over 1 million by year’s end…The combined reshoring and foreign direct investment (FDI) announcements in 2019 totaled more than 117,000 manufacturing jobs, plus an additional 24,800 in revisions to the years 2010 through 2018…Additionally, the number of companies reporting new reshoring and FDI was at the second highest annual level in history:  1,100 companies.”

Jobs Announced, Reshoring and FDI, Cumulative 2010-2019

The report states: “Only products that have been offshored/imported can be reshored. Thus, the products least suitable for offshoring never left, such as heavy, high volume minerals, high mix/low volume items or customized automation systems.

The most active reshoring is by those that left and probably should not have done so, including machinery, transportation equipment and appliances. As the data indicates, reshoring is focused on products whose size and weight, e.g., transportation equipment, or frequency of design change/volatility of demand, e.g., some apparel, suggest that offshoring never offered great total cost savings.”

The term “FDI” means “Foreign Direct Investment” and refers to foreign companies that are investing in manufacturing plants in the U.S. to produce products closer to their major market of the U.S.  Plants established by Japanese companies such as Toyota and Nissan, and plants established by German-owned BMW are examples of foreign investment.

However, we still have a long way to go as the report states: “When measured by our trade deficit of about $500 billion/year, there are still three to four million U.S. manufacturing jobs offshore at current levels of U.S. productivity, representing a huge potential for U.S. economic growth.”

The report states, “Companies have consistently reported Positive Factors more often than Negative, probably because the companies place more value on demonstrating the wisdom of their current reshoring decision than on what went wrong with their earlier offshoring decision. “

The top ten positive factors that influenced a reshoring decision are:

  1. Proximity to customers/market
  2. Government Incentives
  3. Eco-system synergies/Supply chin optimization
  4. Skilled workforce availability/training
  5. Image/brand
  6. Infrastructure
  7. Impact on domestic economy
  8. Lead time/time to market
  9. Automation Technology
  10. Customer responsiveness improvement

The top ten negative factors influencing the decision to reshore are:

  1. Quality/rework/warranty
  2. Freight cost
  3. Total Cost
  4. Delivery
  5. Rising Wages
  6. Inventory
  7. Supply chain interruption/Natural disaster risk/Political instability
  8. Green considerations
  9. Intellectual Property Risk
  10. Communications

The report states that the top industries that are reshoring or benefitting from FDI are:

  • Transportation Equipment
  • Computer & Electronic Products
  • Electrical Equ8ipment, Appliances & Components
  • Chemicals
  • Plastic & Rubber Products
  • Wood & Paper Products
  • Apparel & Textiles
  • Fabricated Metal Products
  • Machinery

It’s not surprising that China ranks number one as the country from which companies are reshoring, with Mexico, Canada, India, and Japan filling out the top five.  The top countries that are investing in manufacturing sites in the U.S. are: Germany, China, Japan, Canada, and Korea. 

The authors note that “The South and Midwest continue to dominate cumulatively. The Midwest and Texas dominate reshoring and the South dominates FDI.” It was surprising to me that Michigan and New York were in the top five states for the number of jobs that were reshored, as they are not states where the cost of business is low. However, Texas ranked highest for both number of jobs announced and the highest number of companies reshoring.

The report authors state, “We believe the continued strength of the trends thru the end of 2019 is largely based on greater U.S. competitiveness due to corporate tax and regulatory cuts and increased recognition of the total cost of offshoring.”

It was interesting to note the impact of the COVID Pandemic on reshoring.  The authors report: “The COVID Pandemic has increased in interest in reshoring as “Two in three (69%) manufacturing companies are looking into bringing production to North America (compared to 54% in February).”

In addition, “Repeated surveys show that more companies, driven by the virus crisis, have decided to reshore. We expect to see the data respond to this shift in 2021. Also due to the pandemic, we are seeing U.S. reshoring outpacing FDI for the first time since 2014…The national demand to shorten and close supply chain gaps for essential products to make the U.S. less vulnerable is most likely to benefit the following industries: PPE, medical, tech, and defense. Already, 60% of cases after March mention the pandemic as a factor in reshoring decisions. Medical equipment and PPE are the first responders of new reshoring with cases already double from last year.”

In conclusion, the authors state: “The revised rate of reshoring plus FDI job announcements in 2019 was up about 2000% from 2010. The 600,000+ jobs brought back represent about 5% of U.S. manufacturing employment. The acceleration of jobs coming back combined with the decline in the rate of offshoring has resulted in a plateauing of the goods trade deficit at about $800 billion/year. The COVID crisis has revealed the U.S.’s over-dependence on imports.

This data should motivate companies to further reevaluate their sourcing and siting decisions by considering all of the cost, risk and strategic impacts flowing from those decisions. Policy makers can use the continued reshoring successes as proof that it is feasible to bring millions of jobs back.”

Government policies do have an influence on reshoring and FDI. If the next administration reverses the corporate tax and regulatory cuts, it could have an adverse effect on the reshoring trend.

Mixed Messages at San Diego’s Economic Outlook Events

Tuesday, February 9th, 2016

Economists and industry experts presented conflicting outlooks at the three of the Economic Outlook events held in San Diego this month. I attended two of the three ? the 32nd Annual San Diego County Economic Roundtable and the San Diego 2016 Economic Outlook by the National University Institute for Policy Research ? and read about the third, the San Diego Business Journal (SDBJ) Economic Trends event.

The SDBJ event focused on the areas of expertise of industry panelists in banking, health care, insurance, commercial real estate, tax, and employment, which is why I did not attend this event. If you are involved in these industries, then you were happy to hear that these experts forecast a healthy year for San Diego with the U. S. economy growing about 2.5%. Home prices have increased, consumer spending is growing, wages are increasing, and commercial real estate vacancy rates are below the 10-year average.

The other two events paid more attention to the manufacturing sector in which I am involved. Marney Cox, Chief Economist for the San Diego Association of Governments (SANDAG) participated in both events, and he and Kelly Cunningham, Chief Economist at the National University Institute of Policy Research (NUPR) were more cautious, forecasting a more modest 1.9% growth in the region, 2.1% in California as a whole and only 1.8% growth in the U. S.

Kelly Cunningham stated that it took us 74 months after the last recession to get back to the job level we had in 2007, which was two to three times as long as the recessions of 1980-81, 1990-91, and 2000-2001. The average GDP growth after these three previous recessions was 4-5% annual growth, but the U. S. GDP has grown an average of only 2% since the Great Recession. At the SDWP event, Marney Cox opined that the regional GDP growth should be >3%.

San Diego is adding jobs faster than the rest of California, and he forecast that the San Diego unemployment rate would remain at the low of 4.8% reached in December 2015 compared to 5.8% for California. He emphasized that this is the commonly used U3 rate of employment, not the U6 rate that includes part-time and discouraged workers. The U6 rate is about double the U3 rate, and was 9.8% in December 2015. However, the U3 rate doesn’t include people who have dropped out of the labor force. At the SDWP event, Marney Cox stated that 698,000 people had dropped out of the labor force in San Diego since 2005.

What concerns me is that manufacturing is only 9.5% of the regional GDP (based on 2014 data), up from the low of 7.6% of GDP in 2008. This is still considerably down from the high of 30.1% in 1980. It had slipped to 24.8% by the end of 1999, but that is less than a 6% loss in 19 years, whereas we have now dropped another 15.3% in 15 years. Also, San Diego’s GDP dropped from 7th in 1999 to 17th in ranking of the top 35 metropolitan areas in the U. S.

According to NUPR report, San Diego has “added 7,000 manufacturing jobs back as 2015 ended. Half of the new manufacturing jobs are in non-durable goods, one-quarter in aerospace, and the rest among other durable goods production, including shipbuilding and recreational goods…” However, this is about 5% or 6,000 fewer jobs than we had in 2007 (102,400) and more than 26,000 fewer jobs in manufacturing than we had in 1999 (128,300).

Since you have to make it, grow it, or mine it to generate tangible wealth, it is questionable whether or not San Diego can even maintain its level of prosperity in the future. Agriculture did not even show up on the pie chart of GDP for San Diego, and natural resources only represented .5% of the GDP. Thus, it is critical that San Diego maintain a strong manufacturing base. Manufacturing jobs create 3-4 other support jobs, while service jobs only create 1-2 other jobs.

Construction dropped from 3.8% of the region GDP in 2008 to only 3.3% at the end of 2014, but there has been very little recovery in the number of construction jobs as the number of jobs is still down by 12% from what the number was in December 2007. The NUPR report stated, “In 2016 we do not foresee a significant increase of this part of the economy, in part because of the

relatively small number of housing permits approved in the County. Absent a fundamental change of that figure, this part of the economy will continue to struggle.”

Since manufacturing and construction represent good paying jobs for the middle class, this explains why middle wage jobs are decreasing. The NUPR report released at their event defines “middle wage jobs as those paying between $35,000 and $77,000 per year in 2014 dollars” and states that “in 2001 middle wage jobs accounted for 56.6 percent of all payroll wage jobs…the ratio continued to shrink, standing at 49.5 percent as of 2014.”

Essentially in San Diego, we are creating six times more low paying jobs than high paying jobs and double the number of low paying jobs than middle wage jobs. Higher wage jobs “increased from 21.2 percent in 2001 to 26.2 percent by 2014,” and lower wage jobs “increased from 22.3 percent in 2001 to 24.3 percent as of 2014.”

This trend is nothing new. I remember Marney Cox expressing concern over the shrinking number of middle wage jobs at economic roundtables I attended in the mid 1990s.

Another trend Marney Cox mentioned is that the percentage of workers age 55+ has increased from 25% of the workforce to 35.1%, and there has not been a recovery in employment for those ages 25-54. Since these years are supposed to be the “golden years” of making money in a career, this does not bode well for the future for this age bracket. My own son and daughter are in this age bracket, and my son has had to work as an independent contractor since early 2010 without being able to find a permanent, full-time job in an occupation related to construction. Neither of my children has been able to afford to buy a house because with rents as high as they are, they can never save enough money for a down payment. Their dad and I were able to buy our first house in our mid 20s when houses cost about 3-4 times a median annual salary, but now they cost 9-10 times an annual median salary.

As I have mentioned in past articles, San Diego has been an innovation hub of advanced technology for the past 30 years, and we now have many startup companies at various stages of development in the more than 45 different accelerator/incubator programs in the region. This is why I was very concerned when Marney Cox stated that venture funding being invested in San Diego companies has greatly diminished. Last year, venture fund investment was <$One Billion and represented only 2% of national investment compared to 4-5% previously.

If this trend continues, it would have far-reaching effects. San Diego’s diverse industry clusters derived from technology-focused R & D have always helped the region perform slightly better than the rest of the country. However, if early stage companies cannot get venture funding beyond the Angel investor stage, it will be more difficult for them to ramp up into the full production stage where the majority of job expansion occurs. As a mentor for startup technology-based companies for the San Diego Inventors Forum and the CONNECT Springboard program, I am witnessing the increasing difficulty entrepreneurs are experiencing in getting investment funds. Crowdfunding is helping more companies get off the ground, but they will not be able to succeed in the long run and scale up to full production without significant Angel and venture funding.

San Diego’s economy cannot depend on military/defense spending and tourism for growth in regional GDP. Tightening defense/military budgets because of sequestration have been a drag on the San Diego regional GDP growth for the past three years, and the slight increase in defense spending in the current fiscal year budget will not make much of a difference.

These considerations are why I think that the conclusion reached in the NUPR report is valid: “World and national headwinds suggest battening down the hatches with a prognosis for tightening economic conditions…San Diego will be fortunate to achieve a seventh year of continuous positive economic momentum in 2016. These indicators of economic activity, however, do not portend an acceleration, but rather uneasy movement going forward.”

Based on the economic indicators I am seeing for the national manufacturing industry, I would say that these words of caution should also be applied nationally.

Congress Hasn’t Averted the Real Fiscal Cliff

Tuesday, January 15th, 2013

The “kick the can” legislation that passed in the wee hours of January 1st didn’t address the real economic issues threatening a fiscal cliff for the United States ? the massive trade deficit and the rapidly escalating national debt. This article will show how these two economic issues are interrelated.

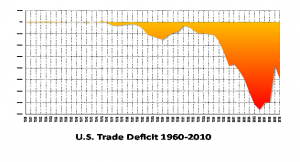
The trade deficit grew from a low of $91 million in 1969 to a peak of $698.3 billion in 2008, dropping down to$379 billion in 2009 due to the worldwide recession before climbing back up to $559.8 billion in 2011. Final figures for 2012 are not available yet, but the trade deficit through the first 11 months of 2012 is running at an annual rate of $546.6 billion.

Our trade deficit with China grew from only $6 million in 1985 to a high of $295.4 billion in 2011, after it had dropped down to $226.8 billion in 2009 during the recession. China’s portion of America’s trade deficit has nearly tripled ? from 22 percent in 2000 to 60 percent in 2009 and 52.7 percent in 2011. In the 11 years since China joined the WTO, the U.S. trade deficit with China has grown by 330 percent.

The national debt has grown from $5.6 trillion in 2000 to $16.4 trillion on January 12th. As of July 2012, $5.3 trillion or approximately 48% of the debt held by the public was owned by foreign investors, the largest of which were China and Japan at just over $1.1 trillion each.

“The estimated population of the United States is 314,243,893 so each citizen’s share of this debt is $52,304.77. The National Debt has continued to increase an average of $3.84 billion per day since September 28, 2007!”

As you can see, the debt accelerated after the economic collapse in the fall of 2008 and has continued to accelerate since because of the recession, automatic increases in unemployment benefits, food stamps, and social security payments for early retirement, as well as stimulus spending. The all-time record of increasing the debt by $1.1 trillion was set by President Bush in 100 days between July 30 and Nov 9, 2008 to avert the economic collapse of major banks and Wall Street companies. “Recessions cut tax revenues—in this case, dramatically, which accounts for nearly half of the deficit.”

According to Tom Donohue, head of the U.S. Chamber of Commerce, the nation’s largest business lobbying group, “The single biggest threat to our economic future … is our exploding national debt, driven by runaway deficit spending, changing demographics and unsustainable entitlements,” he said in his annual “State of American Business” address.

The reason why our massive trade deficit and escalating national debt are interrelated is that they share a common factor:  the American manufacturing industry and the jobs it generates or the jobs it has lost.

According to the Information Technology and Innovation Foundation report, the U. S lost 5.7 million manufacturing jobs in the decade of 2000 to 2010, more than the total number of manufacturing jobs than the rate of loss in the Great Depression (33.1 % vs. 30.9%). Manufacturing jobs now only make up 9% of the American workforce, down from about 14% in 2000. Two million manufacturing jobs were lost in the Great Recession, adding to the 3.7 million we had already lost. Less than 10% have returned since the end of the recession. The report concludes:

  • A large share of manufacturing jobs was lost in the last decade because the United States lost its competitive edge for manufacturing. It was due to a failure of U.S. policy, not superior productivity.
  • The loss was cataclysmic and unprecedented, and it continues to severely impact the overall U.S. economy.
  • Regaining U.S. manufacturing competitiveness to the point where America has balanced its trade in manufacturing products is critical to restoring U.S. economic vibrancy.
  • Regaining manufacturing competitiveness will create millions of higher-than-average-wage manufacturing jobs, as well as an even greater number of jobs from the multiplier effect on other sectors of the economy.
  • The United States can restore manufacturing competitiveness and balance manufacturing goods trade within less than a decade if it adopts the right set of policies in what can be termed the “four T’s” (tax, trade, talent, and technology).

The Economic Policy Institute briefing paper, “The China Toll,” written by Robert Scott focuses on the effects of our trade deficit with China. He wrote, “Growing U.S. trade deficit with China cost more than 2.7 million jobs between 2001 and 2011, with job losses in every state.”

“Between 2001 and 2011, the trade deficit with China eliminated or displaced more than 2.7 million U.S. jobs, over 2.1 million of which (76.9 percent) were in manufacturing. These lost manufacturing jobs account for more than half of all U.S. manufacturing jobs lost or displaced between 2001 and 2011.”

The growing trade deficit with China has been a prime contributor to the crisis in U.S. manufacturing employment. When you take into account the multiplier effect of manufacturing jobs creating three to four other jobs, the U. S. has lost six to eight million jobs as a result of the trade deficit with China alone. The Department of Commerce estimates that each $1 billion in trade deficit translates to about 13,000 lost jobs, so the $559.8 billion in the total trade deficit for 2011 represents a loss of 7,277,400 jobs. This explains why we have had a virtually jobless recovery since the end of the recession and why the unemployment rate has stayed high for so long.

The average manufacturing job nationwide pays about $40,000 per year ($20/hour). According to the 2012 federal tax table, a person making that amount of money would pay about $4,000 to $5,000 per year in taxes, depending on whether they are single or have one dependent. Without doing the complicated math to calculate the number of lost manufacturing jobs each year times the taxes those workers would have paid, you can see that the result could be trillions of dollars in lost tax revenue since the year 2000.

Adding this lost tax revenue to the cost of an unemployed worker in the form of unemployment benefits (about $15,000 year for a $40,000/year job) and possibly food stamps, you can understand the major cause of why our national debt has escalated so dramatically in the last ten years. We could raise income taxes to the highest rates of European countries such as Sweden (75%) and still not be able to pay down our national debt. The solution is not raising taxes, it is creating more tax payers, especially those employed in the higher paying jobs of the manufacturing industry. Our trade policies that result in such huge trade deficits and loss of manufacturing jobs have transformed taxpayers into tax consumers.

Because of our trade deficit with China and our national debt, we are essentially writing two checks to China every month:  one to pay for the cost of the imports we buy and the other to pay for the cost of borrowing money from China to pay for the cost of running our government.  By maintaining this trade deficit, we are sending our tax revenue to China; then, we borrow a portion of it back to pay our expenses. This is unsustainable!

We are at a cross roads in our country. We must change our tax, trade, and regulatory policies to rebuild our manufacturing industry to increase the number of taxpayers if we ever want to pay down our national debt, reduce our unemployment rates, and avoid economic collapse.